Content


Copywriter at Promodo
Over nearly three years as a copywriter, I’ve written for US and European startups and companies, including SE Ranking. I enjoy working with words—finding the right phrasing, organizing ideas, and turning them into clear and useful content that shows real value and helps businesses grow.
SEO gives you a lot of numbers, but are they good or bad for your business? We know you want to know whether SEO brings the results.
In this guide, together with an SEO expert, we've gathered SEO metrics that actually matter. You’ll see what to track and the ways to find your own reference points so you can set targets that make sense for your market.
In SEO, universal benchmarks are hard to define. In some cases, a relative approach works better.
The best way to understand what a good result is in your case is to compare it with your direct competitors and aim to outperform them. The numbers we provide are rather a general guide than exact targets.
SEO benchmark: Your average monthly organic sessions over the last 3–6 months (or peak season), broken down by key landing pages. Track as a rolling baseline in GA/Search Console, use Ahrefs/Semrush for competitor estimates as directional context.
On average, about 50–60% of website visits come from organic search. Highly successful websites often rely even more on SEO, with 70% or more of their traffic generated organically.
On the other hand, relying too heavily on organic search can be risky. If 80–90% of your traffic comes from Google, it may indicate you rely heavily on a single source. If you keep the balance, you can reduce this risk and make growth more sustainable.
There are some numbers we took from the Similarweb's 2025 Marketing Benchmark Report, to see the general picture for some industries.
In the insurance industry, organic search accounts for around 20–27% of total traffic. Challengers generate the highest share (27.3%), followed by up-and-coming brands (23.3%), while larger players rely less on SEO (19.9%) and more on direct traffic.
Business and consumer services sit in a similar range. Organic search contributes about 19% to 24% of total traffic. Challenger brands rely most on SEO (~24%), followed by up-and-coming companies (22%). Larger brands capture a smaller share of organic traffic (~19%) and depend more on direct traffic.
In the luxury segment, a strong organic share typically falls within the 30–40% range. In practice, organic traffic accounts for about 32% to 40%, with up-and-coming brands leading (39.7%), followed by challengers (38.8%) and established players (32.4%).
In the banking, credit, and lending sector, organic traffic is lower, typically 15–22%. Up-and-coming brands are at the higher end (22.2%), challengers sit around 19.4%, and larger brands are closer to 14.9%.
In beauty and cosmetics, organic search makes up around 31–34% of total traffic, making it a key acquisition channel. The distribution is quite balanced across company types: about 33.5% for established brands, 31.1% for challengers, and 33.1% for smaller players.
The news and media industry sees slightly lower organic shares (around 21–25%). Challengers (25.1%) and up-and-coming sites (25.0%) are at the higher end. Established publishers generate about 21.2%.
In the accommodation and hotels sector, organic search contributes 23–30% of total traffic. Smaller brands lead with 29.7%, challengers follow with 25.9%, and larger players account for about 22.8%.
Finally, in air travel, the organic channel remains one of the main traffic sources, contributing around 33–37% of visits. Smaller brands show the highest reliance (37.4%), while challengers (33.2%) and larger airlines (32.6%) are slightly less dependent on SEO.
SEO benchmark: Positions of your top target keywords tracked against direct competitors in Ahrefs or Semrush. Use competitor rankings as the baseline; aim to match or surpass them for each shared keyword.
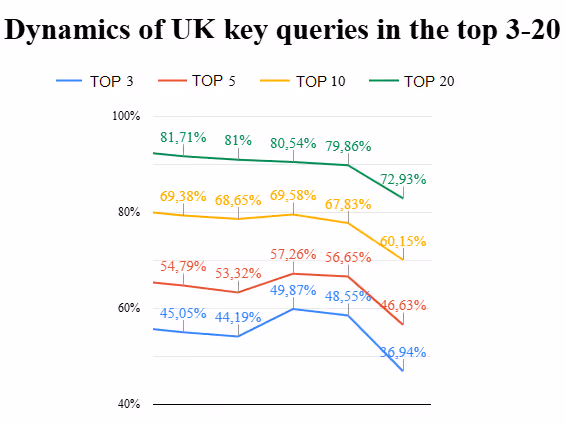
Keyword ranking benchmarks in SEO are relative and mostly depend on competition. Of course, ranking on the first page for primary keywords is already a great achievement. Ranking in the top 3 is even better. But apart from the common reference points, the real benchmark is how you perform compared to competitors.
To set realistic ranking benchmarks of your website ranking, start with competitor research. Identify your main competitors in search (those ranking for your target keywords).
Use tools like Ahrefs, Semrush, or similar to check:
Focus on keywords you have in common and compare positions. This will show what level you need to reach to compete.
At the same time, keyword usage has changed. According to the stat (2025), top-performing content today uses about 50% fewer keywords than it did two years ago. It means keyword-heavy optimization is losing to more natural, intent-focused content.

SEO benchmark: Your current CTR by query group (position + intent) in Search Console over the last 3 months. Compare against the position ranges in the table; a CTR drop at a stable position signals SERP feature competition or weakening brand recognition.
Focus not on the "average CTR of a site," but on CTR within a group of similar queries with the same intent. For example, separately for non-brand informational queries and for commercial queries, at positions 1, 3, and 5, for different page types.
- Oksana Babenko, SEO specialist at Promodo
The first page of Google captures roughly 71% of all clicks, showing the importance of ranking in the top results. Even within the first page, competition is still high: the top three results alone account for around 55% of clicks.
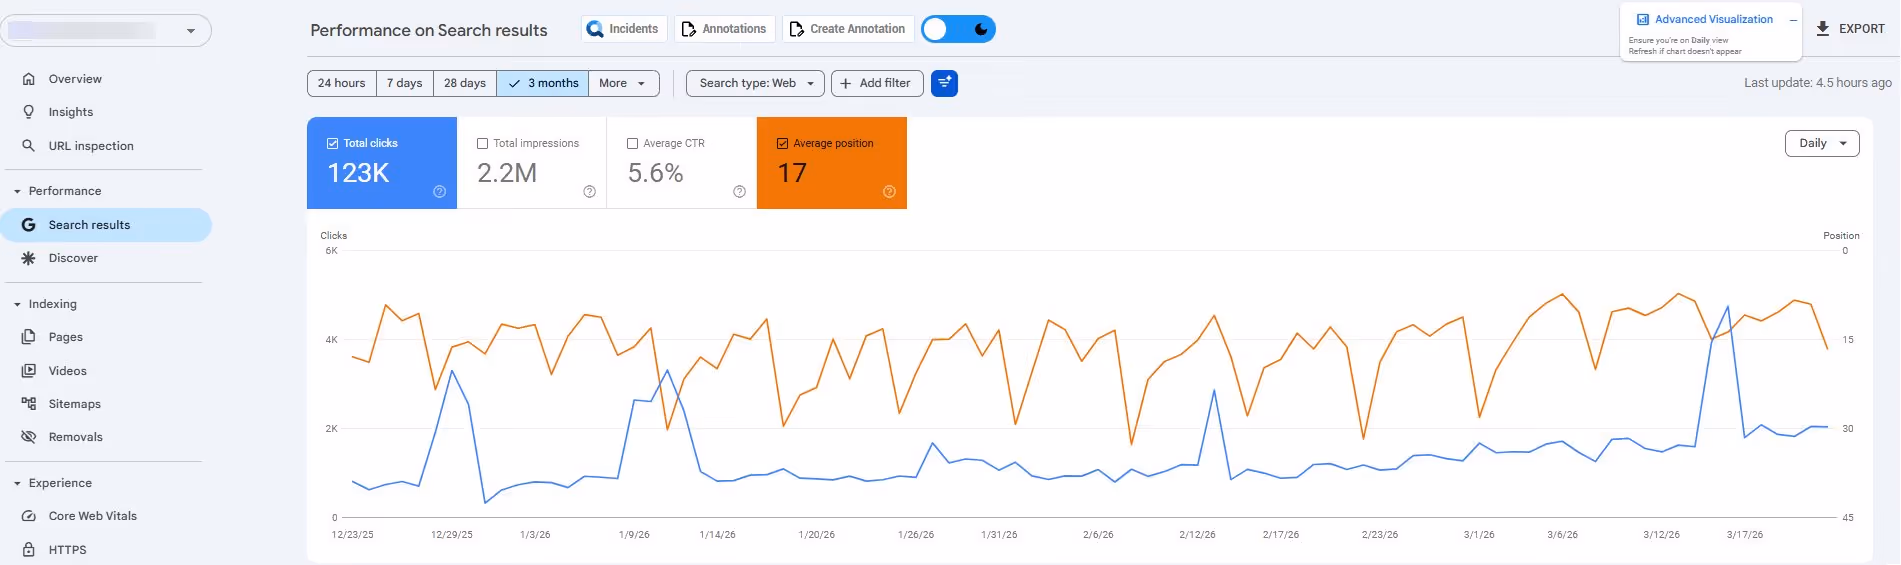
The #1 result typically gets about 30–40% of clicks, while positions two and three see around 15–20%.
As for the example numbers, here are the average SEO CTR benchmarks for 2026 across non-branded queries (combined desktop and mobile), based on Linkdrip data:
Again, these benchmarks are useful as a general reference, but CTR in SEO can vary based on search intent, SERP features (such as ads or AI results), and brand recognition.
To understand what a good CTR looks like for your case, compare performance across similar queries and track changes over time.
SEO benchmark: CR segmented by page type (product, landing, blog) and traffic source in GA. Set separate baselines for each combination and use your best-performing pages as the primary targets.
In eCommerce, the average conversion rate is typically between 1% and 3%, though it can vary widely by industry and product category. For lead-generation websites, typical conversion rates range from 2% to 5%.
According to Dynamic Yield, here are the average conversion rates across industries over the last year. They can be considered as a good CR:
However, conversion rates can vary significantly depending on the traffic source. Organic traffic often behaves differently from paid or direct channels. For example, according to Convertibles, conversion rates from organic search typically range between 2.7% and 3.0%.
At the same time, SEO conversion rates depend heavily on search intent and page type. Users who land on product or service pages are usually closer to making a decision, which is why these pages convert better than informational content, where users are still researching. It’s not the whole picture, though.
A blog post might have a conversion rate of just 0.3%, but if readers come back later, for example, through a branded search and convert, that content is still doing its job in the SEO funnel.
- Oksana Babenko, SEO specialist at Promodo
Branded traffic also tends to convert more effectively, as users already know the company and have higher trust. At the same time, non-branded queries often bring in colder audiences who need more time and touchpoints before converting.
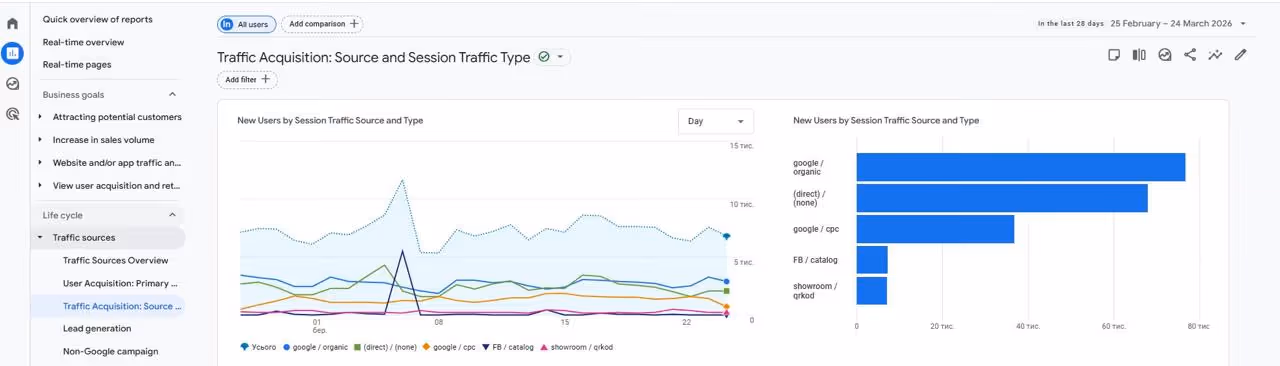
SEO benchmark: Your branded vs. non-branded traffic split in Search Console, tracked over time. The goal is to grow both: non-branded attracts new users, and branded grows as more people know your brand.
The right balance between branded and non-branded traffic depends on your business stage.
If your brand is still new, most of your traffic will likely come from non-branded queries. That’s okay, as people don’t know you yet, so they search for products, categories, or problems instead of your name.
As your SEO efforts start to work over time, branded traffic should grow. This means more people recognize your brand and come back to it directly through search.
If almost all your traffic is branded, your SEO reach may be too limited, and if it’s almost entirely non-branded, you may be attracting new users but not building lasting brand awareness.
There are no universal benchmarks for this split. It varies too much depending on your industry, brand maturity, and marketing strategy. That’s why your own trend over time matters more than any fixed number.
To measure it, use Google Search Console. Filter queries that include your brand name (and its variations), and compare them to all other queries. This will give you a clear view of how your traffic is split.
Changes in the balance between branded and non-branded traffic can also affect keyword rankings if your site has a high share of branded organic traffic. A medical site is a good example: an ad campaign that wasn't set up correctly started pulling traffic from organic to paid, and keyword rankings dropped as a result.
- Oksana Babenko, SEO specialist at Promodo
.avif)
SEO benchmark: Number of referring domains pointing to pages ranking in the top 3 for your primary keywords. Pull from Ahrefs/Semrush, compare to your own pages, and target slightly above the leading competitor per keyword group.
Backlinks are still one of the main ranking factors in SEO, but there is no fixed number you should aim for. The right amount depends on your industry and competition.
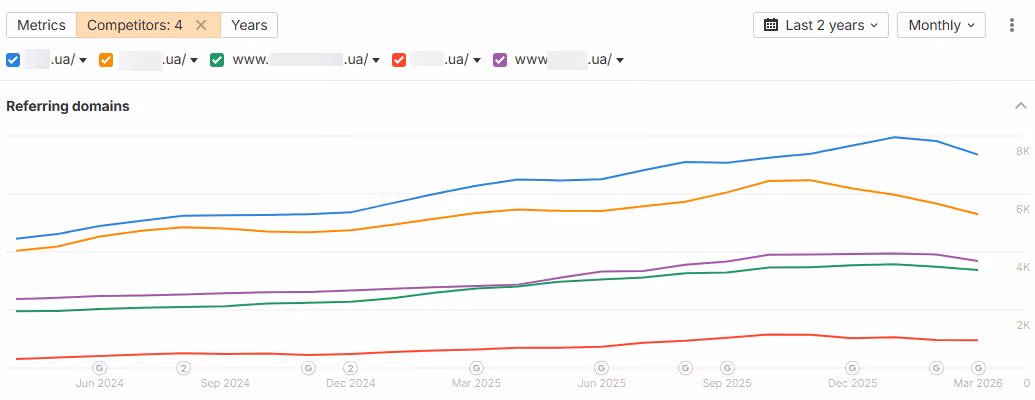
Some data helps set the context. Around 66% of pages have no backlinks, so even a small number can already give you an advantage. At the same time, pages in position #1 have about 3.8x more backlinks than those ranking lower. In competitive niches, large websites can have 100,000+ backlinks.
However, in SEO, backlink benchmarks are always relative, so these numbers are only general reference points.
The best way to set a target is to look at your competitors. Using SEO tools like Ahrefs or any other, you can:
An important thing is that quality and relevant links carry more weight than just volume.
Keep in mind that a competitor's page might have fewer referring domains than yours, but still outrank you thanks to more relevant links from niche sites and stronger internal linking. That combination can be enough to push them to the top.
- Oksana Babenko, SEO specialist at Promodo
Instead of aiming for a fixed number, use competitor data as your baseline and set a target slightly above it. It will give you a more realistic benchmark for your market.
Here are the benchmarks on Core Web Vitals from Google:
A page is considered to pass Core Web Vitals if 75% of its visitors experience “good” performance. Top-ranking pages are about 10% more likely to meet these requirements than lower-ranking pages.
When analyzing performance in PageSpeed Insights, prioritize mobile field data over lab data. This way, you will see how real users actually experience your site, rather than results measured in a controlled environment.
- Oksana Babenko, SEO specialist at Promodo
SEO benchmark: Average pages per session by page type (blog, product, service) from Google Analytics over the last 3 months.
Page-view benchmarks vary by industry and page type. For example, websites where users compare options (like travel or hotels) usually have higher page views, while blogs or news sites tend to have fewer.
It’s because users often visit content sites for a specific piece of information. Once they find what they need, they leave without exploring further. In contrast, on eCommerce or travel websites, users are more likely to browse multiple pages before making a decision.
User intent also plays a role. Visitors who are ready to buy or choose something tend to view more pages, while those looking for quick answers usually don’t.
The best way to define a benchmark is to compare similar pages on your own site and look at competitors' rankings for the same keywords. It will help you understand what level of engagement is realistic for your case.
Industry data can still be useful to understand general patterns. According to SimilarWeb data, page views vary by industry, but we can still see clear engagement patterns.
In the insurance industry, the numbers range from 7.27 to 7.69. Challengers lead (7.69), while giants (7.27) and newer companies (7.29) show similar engagement levels.
For Business and Consumer Services, 9+ page views per visit is considered a strong result. Larger brands reach about 9.7, challengers are close (9.6), while smaller sites drop to around 6.9.
In the banking, credit, and lending sector, page views per visit are lower, typically around 6.5–7. Larger brands are slightly ahead (~7), with challengers (~6.7) and smaller players (~6.5) close behind.
A similar trend appears in beauty and cosmetics, where page views per visit typically range from 7 to 7.5. Challengers lead (~7.5), followed by established brands (~7.2) and smaller sites (~5.7).
In news and media, users view fewer pages—about 4–6 per visit. Larger publishers reach about 5.9. Challengers (~4.7) and smaller sites (~3.9) show lower engagement.
The accommodation and hotels industry shows the highest engagement, with 11 to 14 page views per visit. Larger brands lead (~13.7), challengers follow (~11.5), and smaller sites drop to around 6.8.
In air travel, page views per visit typically range from 7.5 to 8. Larger airlines are slightly ahead (~8.1), challengers are close (~7.7), and smaller players reach about 5.4.
SEO benchmark: Bounce rate segmented by page type in Google Analytics, using your own best-performing pages as the internal target.
Bounce rate depends heavily on context — especially search intent and page type.
Informational pages often have higher bounce rates, which is normal. Product or service pages should keep users engaged, so lower bounce rates matter more.
Because of this, it’s better to evaluate bounce rate at the page level rather than across the whole site. Compare similar page types (blog, landing, product) rather than using a single number for everything.
GA4 does not have a standard report on failure rates, but you can add these rates as follows:
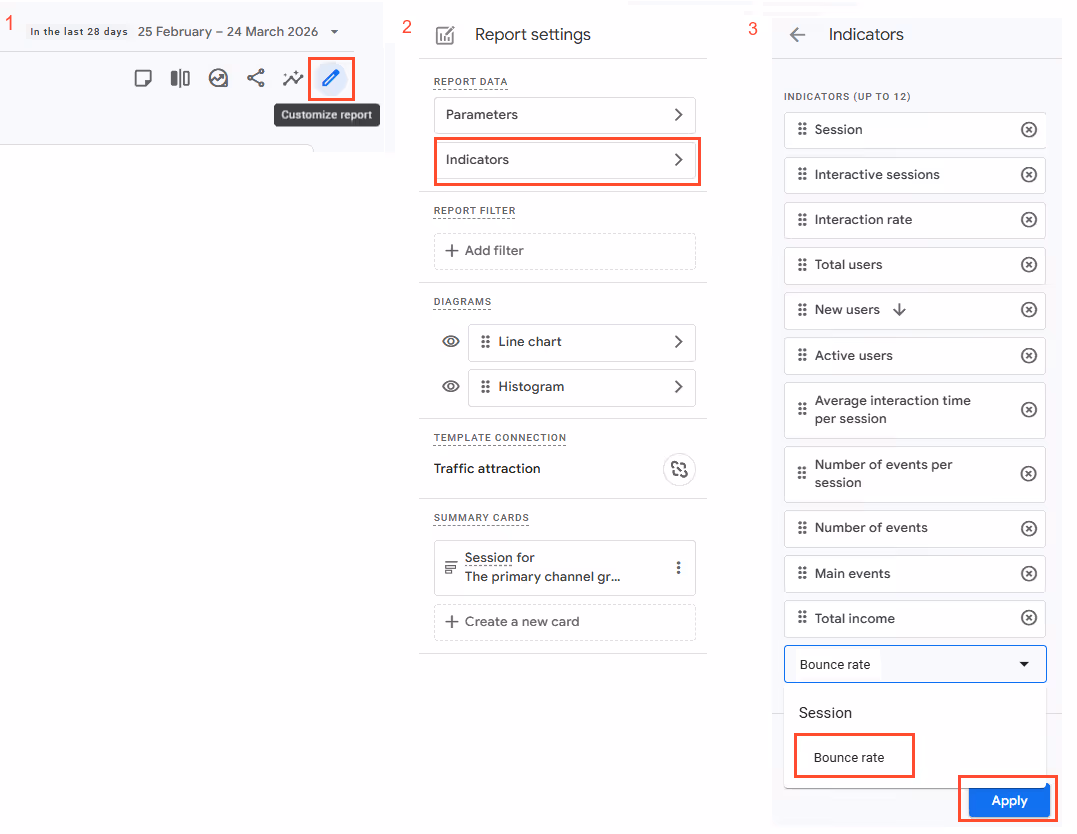
Competitor data is also limited here. Bounce rates can’t be measured accurately for other websites, so they should only be used for general context, not as a benchmark.
The most reliable reference is your own performance. Use your best-performing pages as a baseline and focus on improving pages with higher bounce rates by aligning content with user intent and improving UX.
If an article has an 82% bounce rate but an average session duration of 3 minutes, with users reading through and clicking to related content, that page isn't a problem. But if a service page has a 78% bounce rate, low time on page, and almost no CTA clicks — that's a sign of an intent or UX issue.
- Oksana Babenko, SEO specialist at Promodo
Yet, we can provide some numbers to get the general picture:
Across industries, the average bounce rate is around 40–60%. Sites with particularly strong content and a good user experience may achieve bounce rates below 40%.
Average website bounce rate by industry in 2026:
CXL also provides the average benchmark bounce rate by industry:|
The SimilarWeb report also provides some stats on bounce rate.
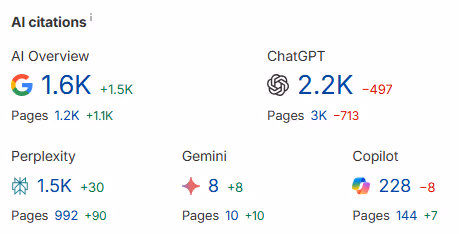
SEO benchmark: Brand mention rate in AI answers (ChatGPT, Gemini, Perplexity, AI Overviews) for your top 10–20 high-intent queries, compared to direct competitors. Track frequency, position, and share over time.
AI visibility doesn’t have fixed benchmarks like rankings or CTR. The results are dynamic, and the same query can produce different answers depending on the platform, context, or user.
Because of this, the most reliable way to evaluate performance is to compare your presence in AI-generated answers with your competitors.
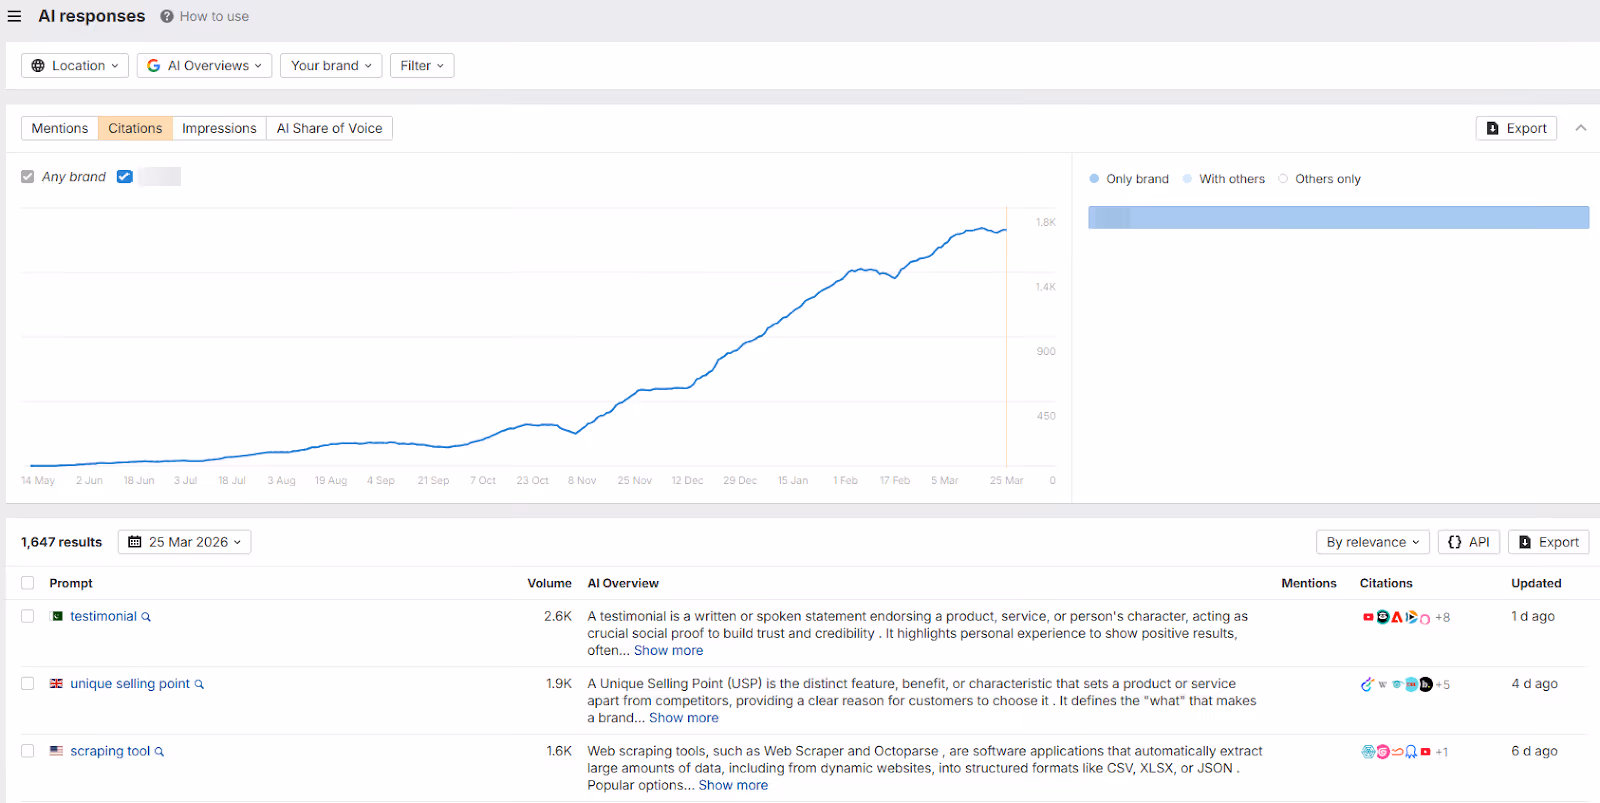
A practical approach is to track:
If competitors consistently appear in answers to important queries and your brand does not, that's a gap you have.
AI traffic can also be used as a supporting signal. In some industries, like insurance, it already reaches meaningful volumes, showing that AI-driven discovery is already impacting visibility.
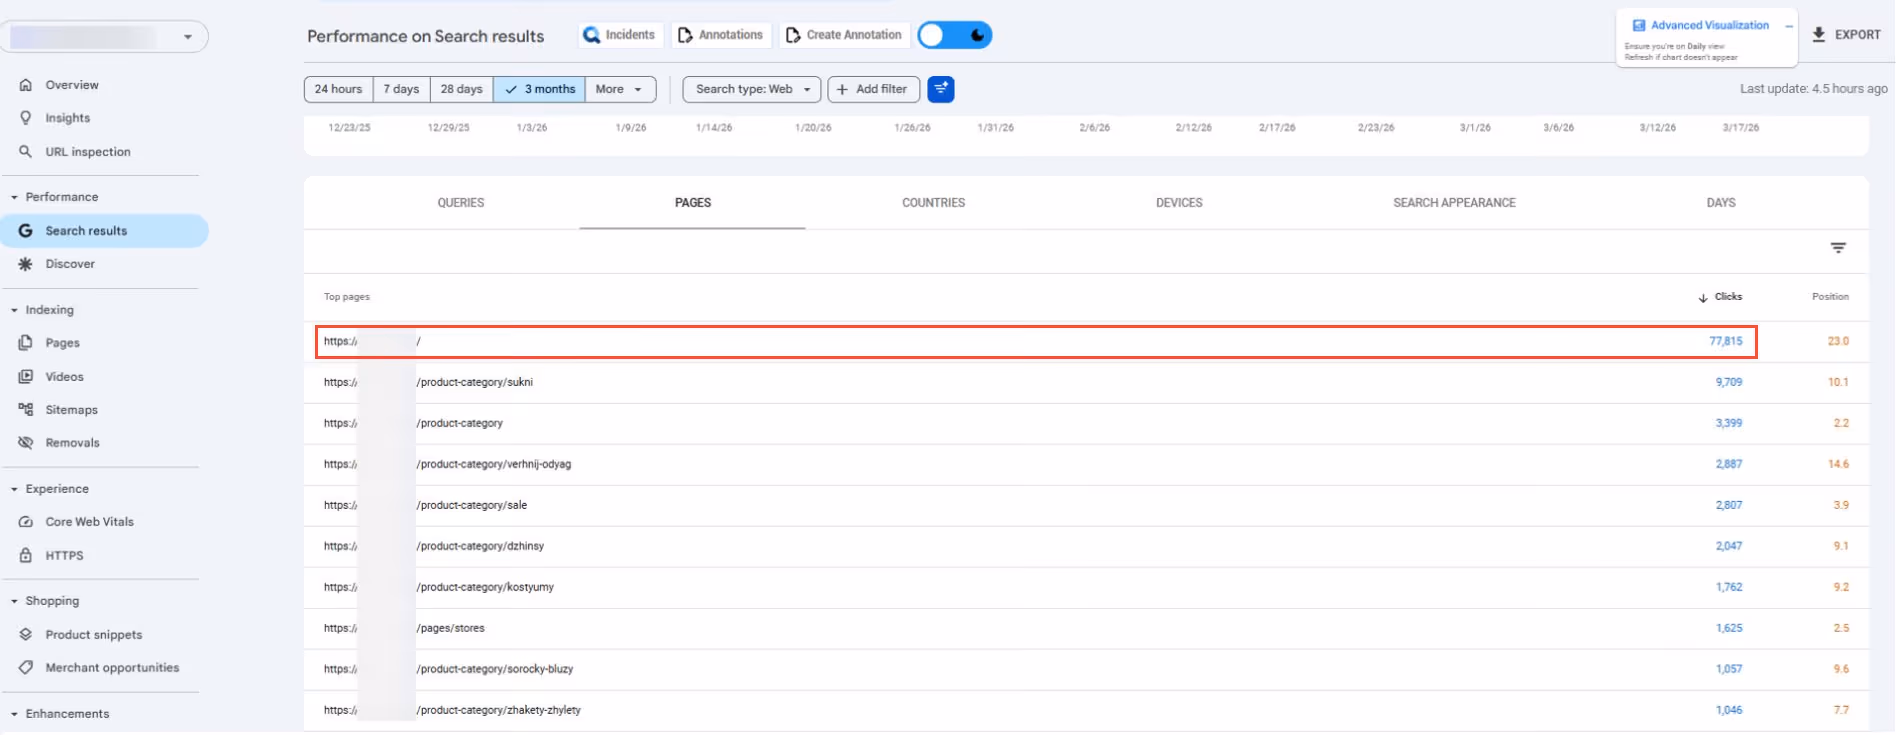
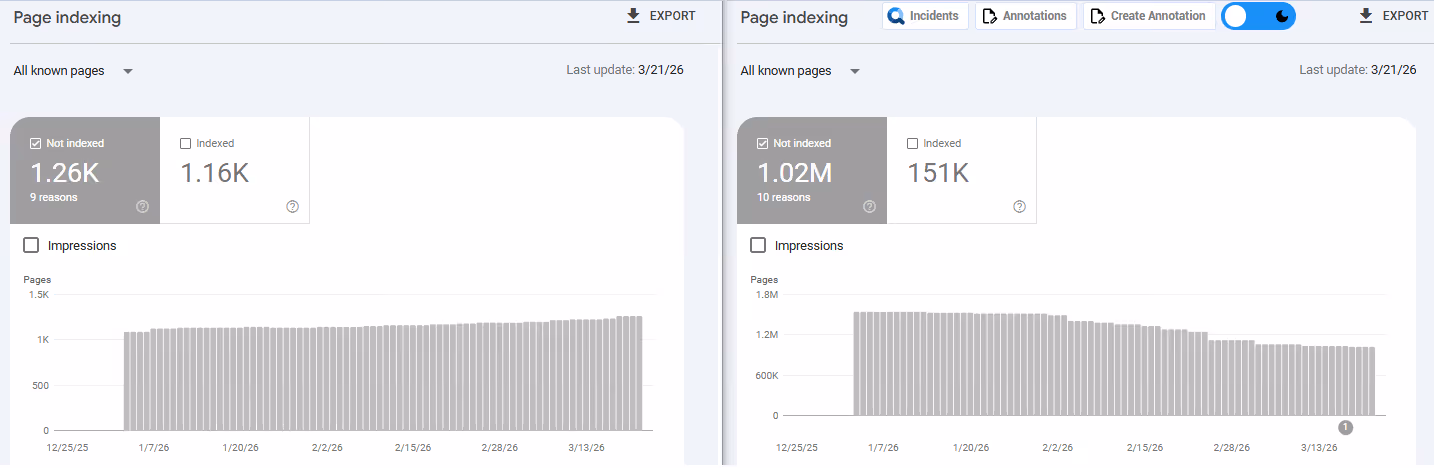
The indexation benchmark is that most of your intentional pages are indexed.
The goal isn't 100% indexation but a clean index. The pages that matter should be in search, and technical, duplicate, or low-value content shouldn't.
- Oksana Babenko, SEO specialist at Promodo
There's no universal benchmark here, and for a good reason. A lean blog with 200 pages should expect nearly all of them to be indexed. A large eCommerce site with thousands of product variants and filtered URLs will naturally have a much lower rate. It’s often intentional, as not every page should be indexed. Thin pages, duplicate content, filtered URLs, and staging pages are better kept out.
To check, open Google Search Console → Pages report. It shows what's indexed and what isn't and why. Some reasons are fine ("Excluded by noindex" on pages you deliberately blocked). Others need attention ("Crawled – currently not indexed" or "Discovered – currently not indexed" on pages you want to rank).
SEO benchmark: Your SOV across your core keyword set compared to your top 3–5 competitors, measured monthly. The goal is to grow steadily and close the gap with whoever is leading.
SOV a purely relative metric. It only means something compared to specific competitors in a specific keyword set. A 15% SOV could be dominant in one niche but insufficient in another.
The way to use it is to define a core keyword list (typically your 50–200 most important target terms), measure your SOV alongside 3–5 direct competitors, and track how the balance shifts over time. Gaining SOV while a competitor loses it is a strong signal that your SEO is working. Losing it, even while your absolute traffic grows, can mean the market is expanding faster than you are.
Most major SEO tools calculate it for you. For example, in Semrush, it's called Market Share within Position Tracking; in Ahrefs, it's Visibility.
SEO benchmarks are way trickier compared to others. What works for a large retail or e-commerce site won't look the same for a SaaS product, or a local service business and that's fine.
Your real target is always relative: know where your competitors stand, understand where you are, and focus on closing that gap.

Copywriter at Promodo
Over nearly three years as a copywriter, I’ve written for US and European startups and companies, including SE Ranking. I enjoy working with words—finding the right phrasing, organizing ideas, and turning them into clear and useful content that shows real value and helps businesses grow.
You may also like
Choose quality and trusted services to improve the presence of your company on the Internet, and feel free to contact our UK team if you have any questions.

More than 7% of daily searches on Google are healthcare-related, which amounts to over 70,000 searches every minute or more than 1b. a day.

If you're seeking to boost traffic to your website, understanding the significance of selecting the right financial keywords is crucial.

Partnering with an email marketing agency can bring valuable benefits to your team. Find the list of signs that signal that you need an agency.
We at Promodo are ready to help you improve your performance across all digital marketing channels.
Get started


.avif)