


MasterZoo
Google Analytics
Google Ads
Meta
Looker Studio
Python
Google Cloud
MasterZoo is a large pet care store chain that has been caring for the comfort and health of pets for over 15 years.
With nearly 200 stores across 38 cities and an online shop, it offers 10,000+ products from 200+ carefully selected brands to meet the needs of furry, feathered, and scaly friends.
To consolidate data from Google Analytics 4, Google Ads, and Meta Ads into a single BI report with Last Non-Direct attribution in order to quickly monitor the performance of all marketing channels and campaigns across product categories, brands, and individual items — while also solving the issue of data sampling.
Like most online stores, MasterZoo tracked channel performance manually, collecting data from various systems:
Consolidating this data and building attribution reports took a lot of time, and viewing real-time performance data for each channel was simply impossible.
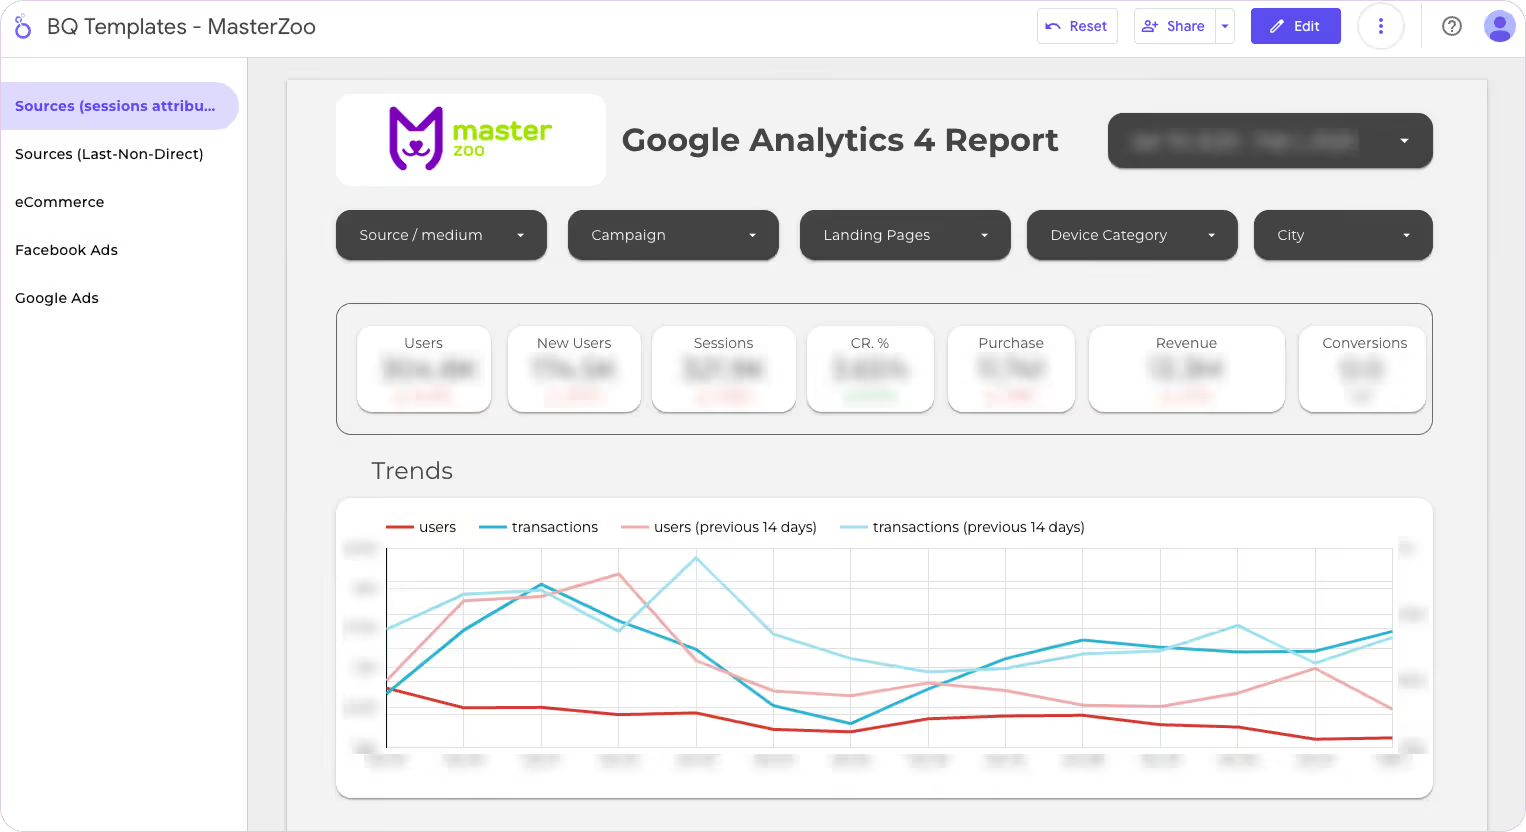
We offered a proprietary Essential report — an analytical solution in Looker Studio. The report collects data from Google Analytics 4, Google Ads, and Meta Ads, and displays key performance metrics of marketing channels.
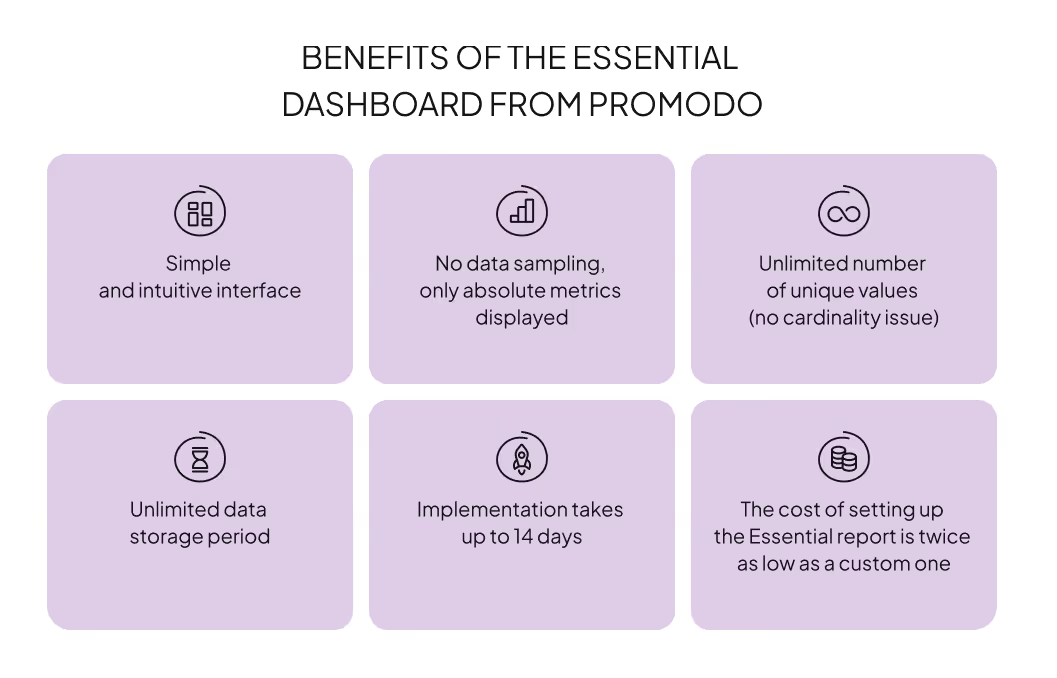
The Essential Report by Promodo makes it easy to analyze key metrics of your online store — product views, add-to-cart actions, number of purchases, and revenue.
With the help of data visualization, you can:
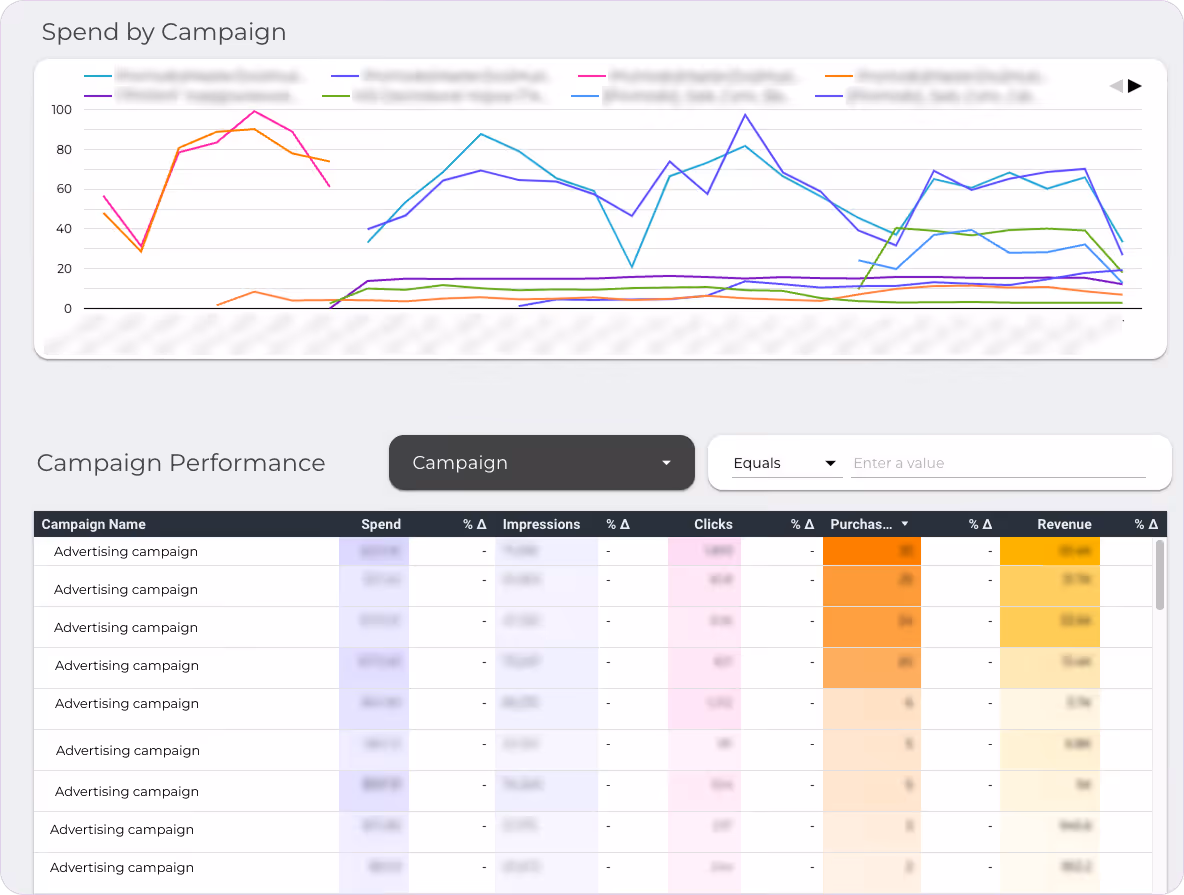
Quickly evaluate campaign and product category performance.
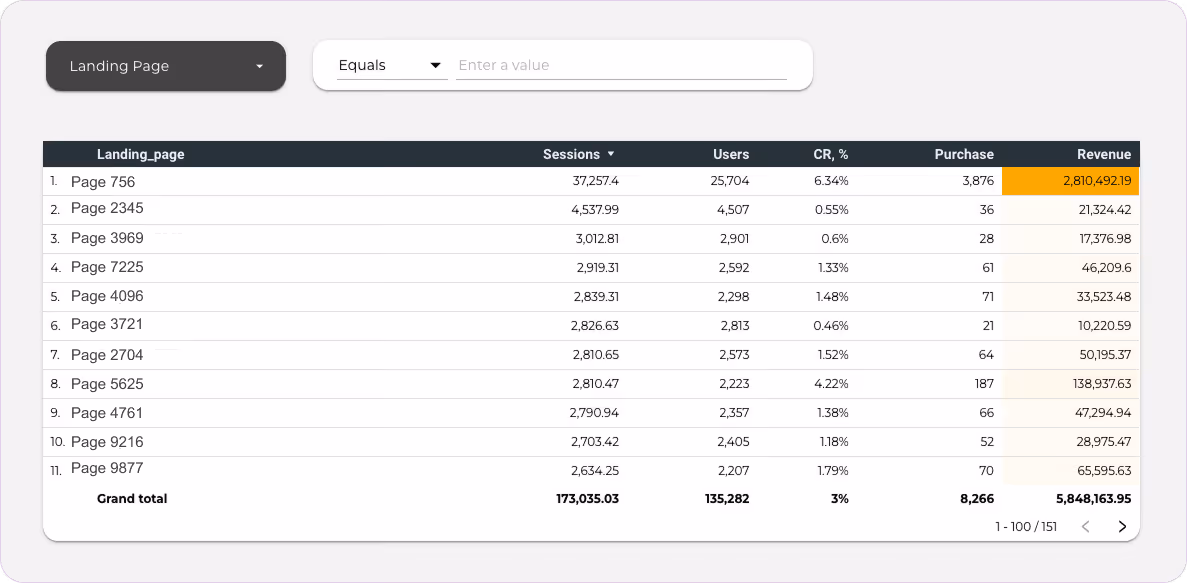
The report allows filtering data by categories, brands, and individual products. This helps identify the most popular items and view their performance across different marketing channels.
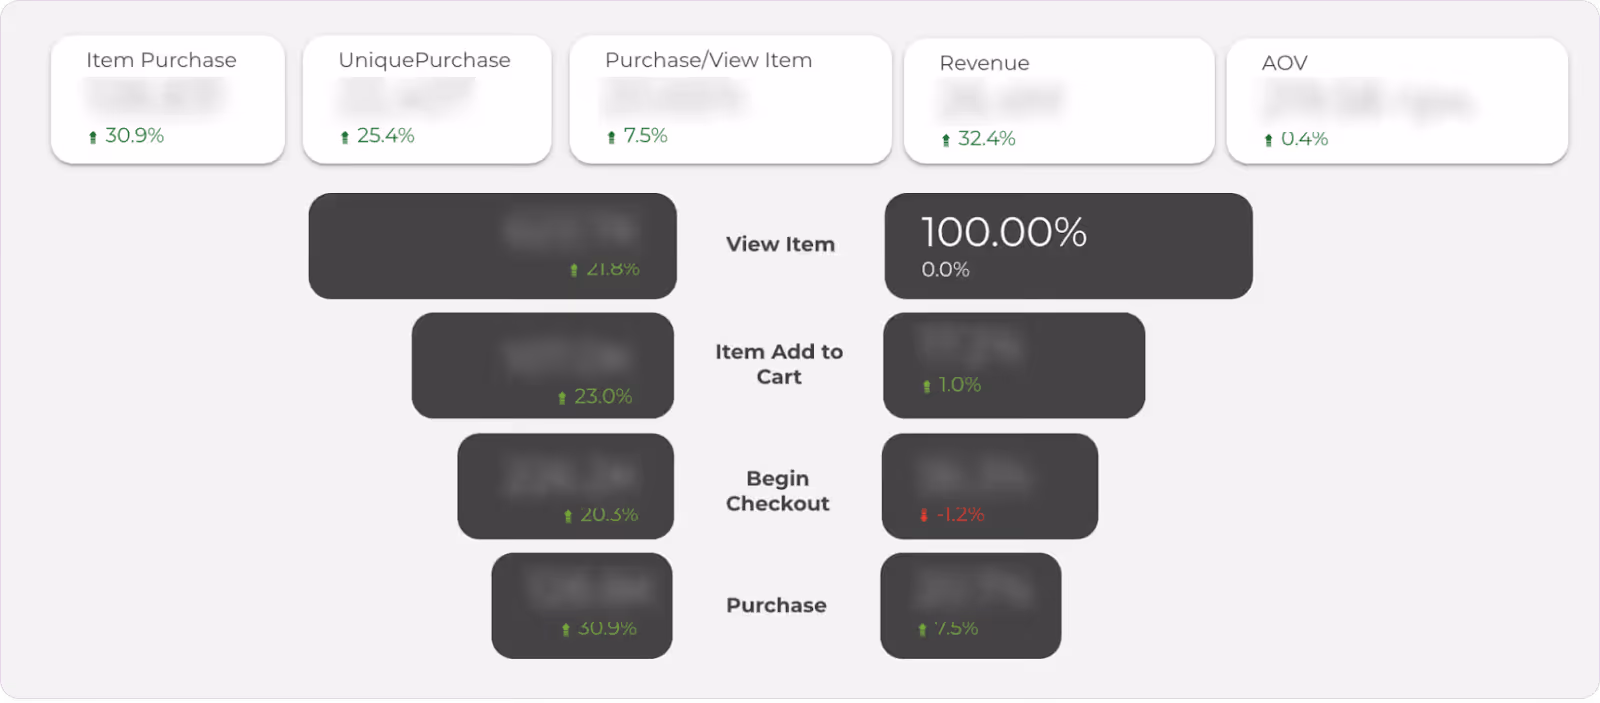
Analyze the sales funnel.
The report displays the percentage of users progressing through each stage of the funnel — from product view to add-to-cart, checkout initiation, and purchase. This enables you to quickly detect bottlenecks in the sales process.
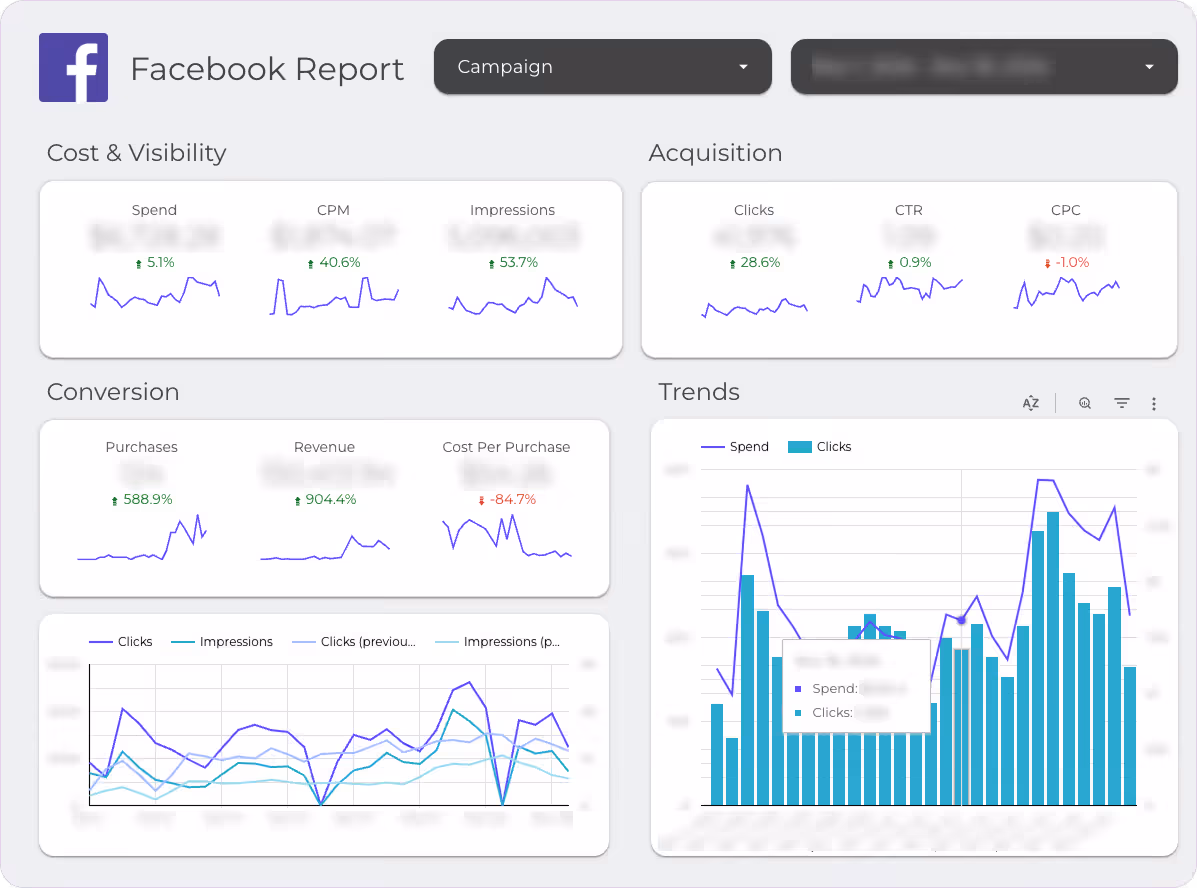
Analyze advertising spend and efficiency.
By integrating data from Meta Ads (Facebook and Instagram), the report allows you to analyze costs, CPM, CPC, and assess how campaigns impact conversions and revenue.
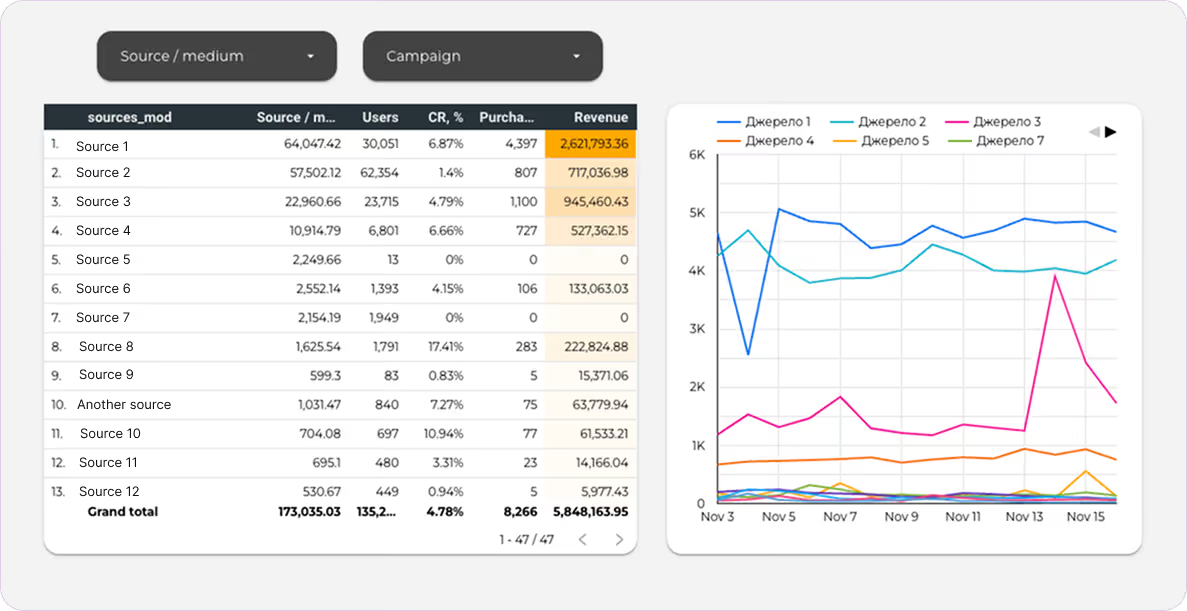
To track the real impact of each channel on conversions, we implemented Last-Non-Direct attribution, which helps avoid overestimating direct traffic channels.
The Last-Non-Direct attribution model is a method of distributing conversion value where full credit for a conversion is assigned to the last user interaction channel that was not direct traffic. For example, if a user first visited the site through a Google Ads campaign, then came back via organic search, and finally converted through direct traffic, the conversion will be attributed to organic search.
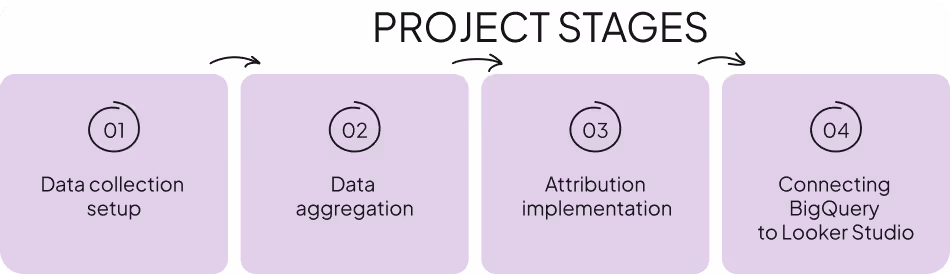
To ensure accurate analytics and complete data coverage, we configured data imports from various systems into BigQuery and organized their daily updates.
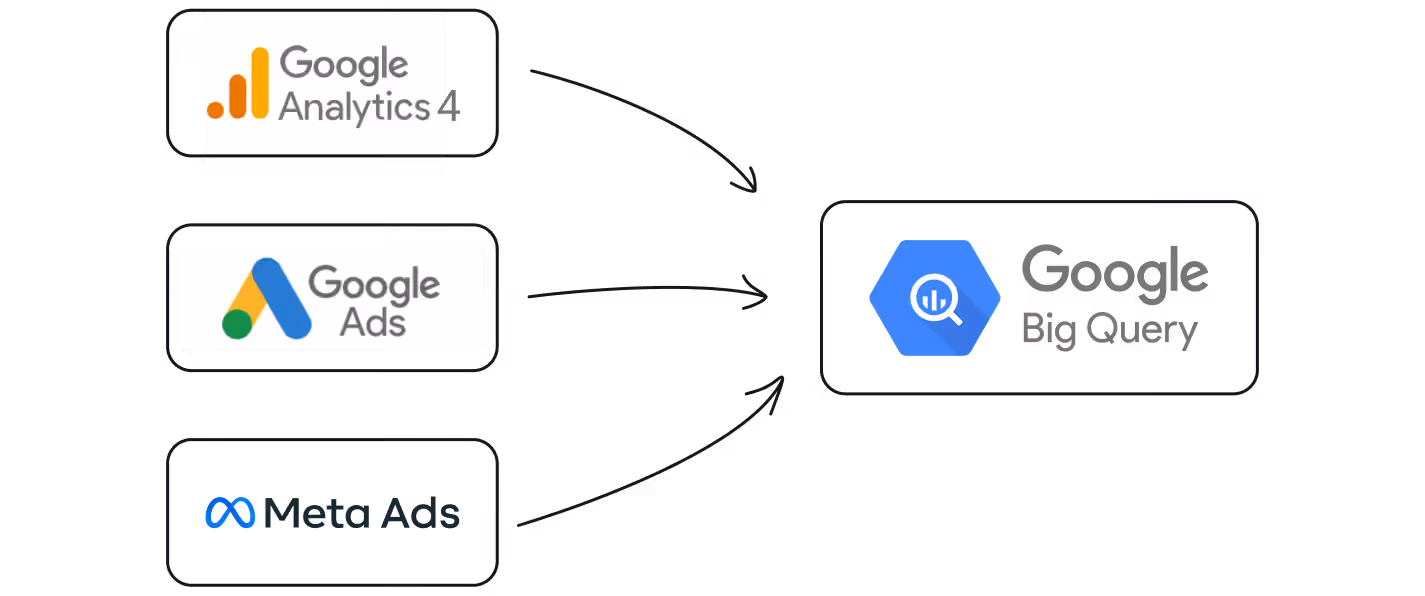
Integrating data from Google Analytics 4 into BigQuery made it possible to collect events without sampling or other GA4 interface limitations.
Using the GA4 API, we also uploaded historical data, allowing the client to analyze information starting from the moment GA4 was implemented.
It’s worth noting that the free version of Google Analytics 4 stores unaggregated data for only 14 months.
Data import from Google Ads was configured using the BigQuery Data Transfer Service. This ensured regular data uploads from the advertising account and automated the integration of data on costs, clicks, impressions, and conversions.
Data from Meta Ads was imported using a custom Python script we developed, which retrieved the required information on costs, impressions, clicks, and conversions through the Facebook API.
Using Cloud Function, we ensured seamless integration and daily updates of this data in BigQuery.
Once data from various sources was collected in one place, we began preparing it for visualization.
Since GA4 data existed in two formats — raw data exported via GA4-BigQuery integration and aggregated data exported via API — Promodo’s analytics team additionally aggregated them to bring all datasets to a unified format.
For the Essential report, we used pre-prepared universal SQL queries to form the tables that would later be visualized. After setting up and adapting the queries to the current project, we ensured the daily update of relevant data.
To enable a deeper analysis of each marketing channel’s impact, we used two attribution models:
The final step was connecting the Essential report in Looker Studio to the created tables.
The Essential report from Promodo enabled MasterZoo to access all up-to-date data on the performance of marketing channels in a convenient format. Now the team can focus on making strategic decisions instead of handling routine operations.
By integrating data from GA4, Google Ads, and Meta into BigQuery, MasterZoo eliminated the need for manual data handling. This saves up to 10 hours per month, eliminates human errors, and provides access to real-time performance reports in Looker Studio.
Note: Google Analytics 4 data updates with a delay of up to 48 hours, and the updated figures appear in the report the following day.
Thanks to Looker Studio, MasterZoo gained an easy-to-use tool for tracking key metrics with filtering options by channel, period, and campaign. This allows the team to quickly monitor ad performance and make timely adjustments.
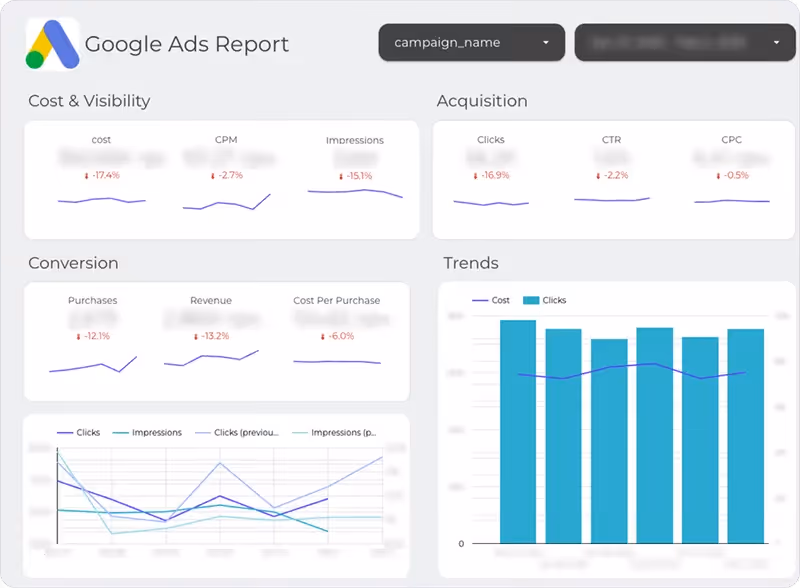
To analyze the performance of Meta Ads and Google Ads, the report includes dedicated tabs with key metrics.
[[SLIDER-START]]
[[SLIDER-END]]
The report allows for a detailed analysis of the sales funnel: from product views to checkout initiation, cart additions, and final purchases.
This makes it possible to identify the stages with the highest drop-off rates and take action to improve them. It also helps to better understand conversion performance across specific categories or even individual products.
Implementing the Last-Non-Direct attribution model made it possible to clearly evaluate the impact of each channel on conversions. This approach helps optimize advertising budgets and adjust strategies to improve ROI.
[[SLIDER-START]]
[[SLIDER-END]]
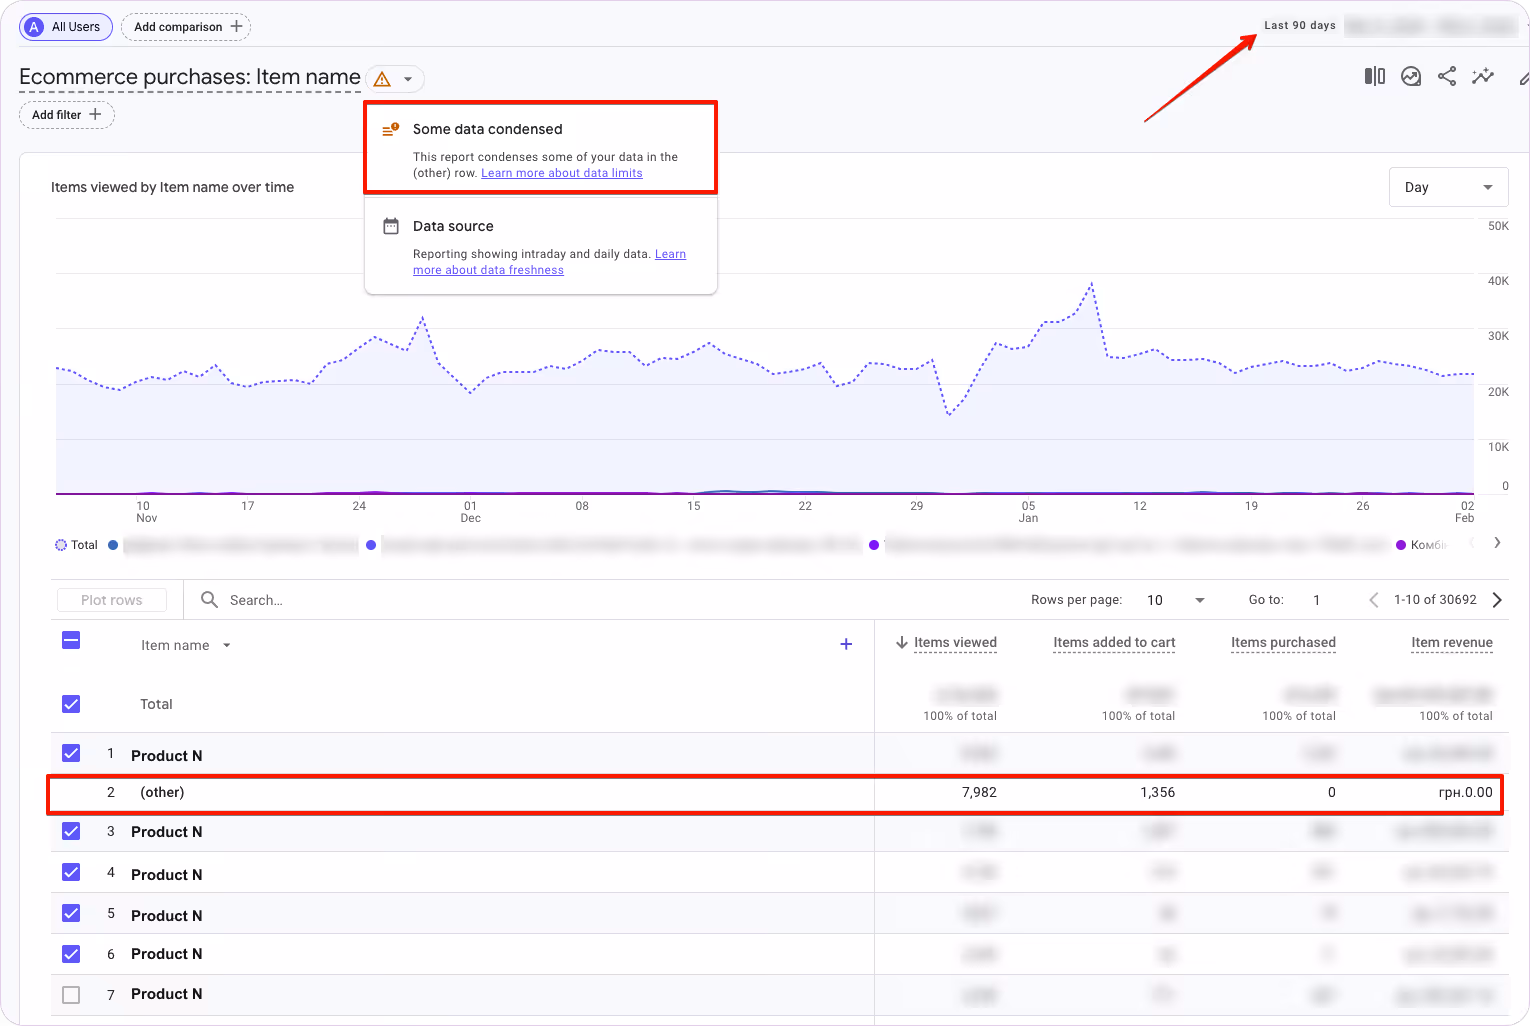
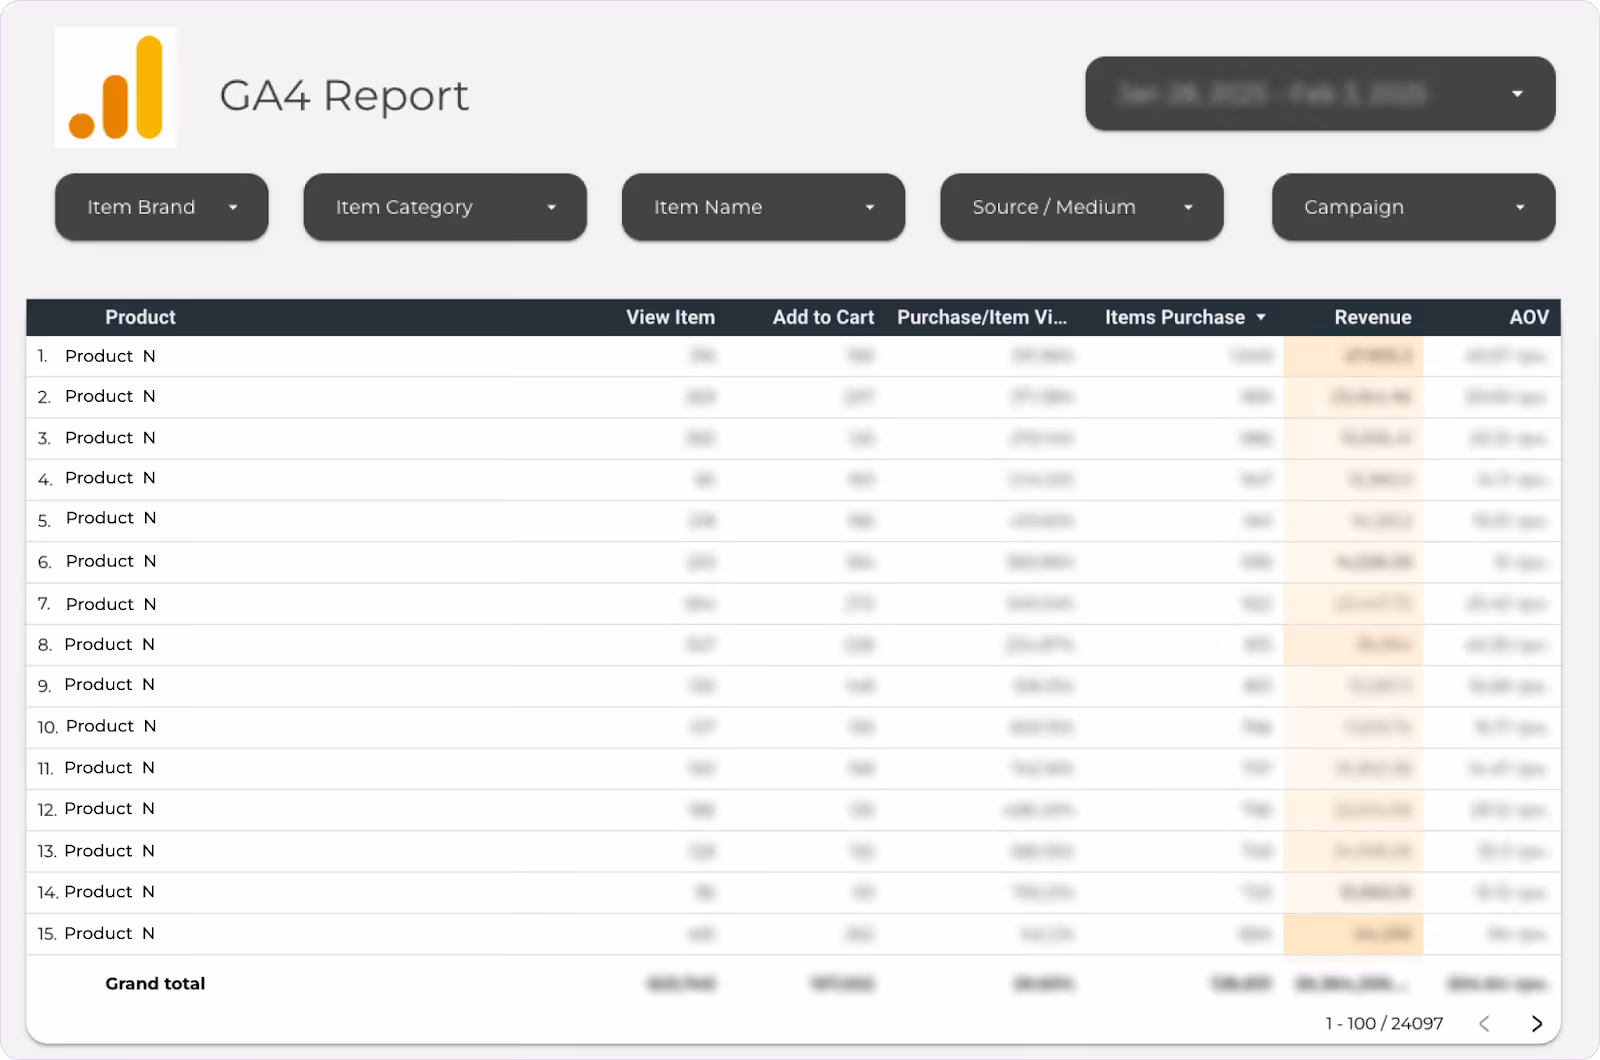
When viewing the product performance report in Google Analytics 4, selecting a 3-month period often leads to some products being aggregated into the “Other” category due to cardinality.
Data cardinality — Google Analytics limits the number of distinct values assigned to a parameter (or custom dimension) and aggregates the excess into “Other.”
In the Essential report, even for a one-year period, all data is displayed in full — without being aggregated into “Other.”
The Essential report by Promodo covers the most important business metrics. At the same time, it serves as a solid foundation for deeper data analysis. Our analysts can enhance this report and implement the following:
Improved attribution models
Implementation of data-driven attribution or models that take into account user interactions at different stages of the funnel (funnel-based).
Adding business plan indicators
For more convenient analysis, the report can include planned metrics for each channel and visualize actual performance vs. plan.
Case studies
Check out how we help companies like yours overcome challenges and rise to the next level.
.png)
Conversions
Share of Online Sales
Work Period


Revenue
Conversions
Work Period


.webp)


