


Toloka is a private investor syndicate focused on investing in fast-growing IT projects with high return potential.
The syndicate brings together private investors seeking a diversified portfolio of international venture investments. It began operations in 2023.
Build a reporting system that enables Toloka to make high-quality, data-driven management decisions quickly based on key business metrics.
Segment the investor database to optimize the marketing strategy and enable personalized communication.
Create a Power BI dashboard to track manager performance by funds raised and number of investors.
At the start of the project, the Toloka team operated without any dedicated accounting systems or CRM, relying instead on separate files to manage processes. In March 2024, the Promodo analytics team joined the project and began by analyzing and structuring the existing materials.
As the business grew, it became clear that manual record-keeping no longer met its needs, which created a strong demand for automation.
The solution was the implementation of Notion, tailored to the specifics of the business and enabling personalized management of investor and partner databases. Within just two months, the client fully abandoned manual files and transitioned to automated reporting in Notion.
Notion is a multifunctional data management platform that helps efficiently organize workflows, consolidate databases, and set up automated reporting according to business needs.
While Notion significantly optimized core processes, it had limitations in terms of customization and advanced data analysis. Since certain business roles within the syndicate structure require continuous data monitoring but do not use a CRM, there was a need for a more flexible analytics system that could meet the needs of all partners.
As a result, we developed a BI reporting system that enables deep data analysis, client segmentation, real-time metric tracking, and provides fast access to up-to-date data for all partners, regardless of their roles.
This reporting system allows Toloka’s top management to make fast, high-quality management decisions, as all key data is available in a single, unified view.
In this case study, we share the results achieved over six months of collaboration.
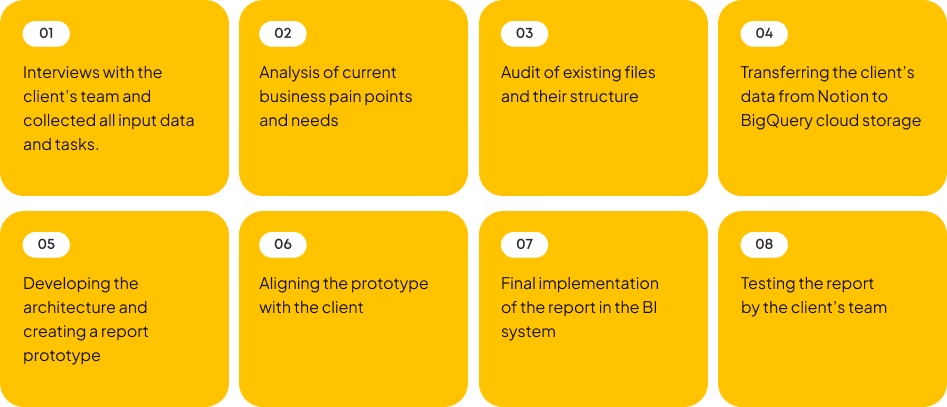
We launched the following stages for the client:
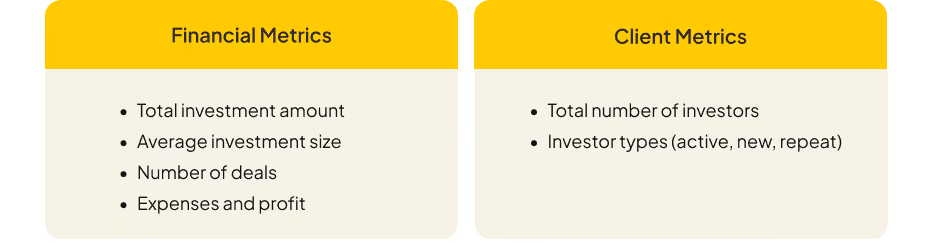
For the main report, we covered:
To ensure reliable storage and data integrity, the Promodo analytics team set up automated data migration from Notion to the BigQuery cloud data warehouse.
Why BigQuery Was Implemented
Automated data transfer from Notion to BigQuery ensured reliable storage, data centralization, and seamless integration for deeper analysis. It also helped avoid data fragmentation that could occur when working exclusively in Notion.
We configured a Google Cloud Function that queried Notion, parsed new data (i.e., transformed it into structured elements), checked for errors and exceptions to prevent incorrect records, and updated BigQuery tables by adding new entries and updating existing ones.
Google Cloud Function is a serverless solution by Google that allows functions to run without deploying servers, ensuring scalability and reducing maintenance costs.
The main implementation challenge was handling all possible exceptions. At the same time, it was necessary to design data transfer logic that could automatically add new columns and projects without modifying the script, while also ensuring real-time data synchronization in BigQuery tables.
Automating the data transfer process helped save the client team’s time, minimize errors, ensure data integrity, and make data analysis in BigQuery more convenient.
First, Promodo analysts prepared the data for analysis and aggregation and designed the report architecture and its prototype.
For the analysis, we collected data on the effectiveness of acquiring new investors and partnerships. We also separately configured tracking of deal statuses and their dynamics.
We built a data structure that included key metrics and segments while accounting for business specifics. Additionally, we implemented analysis of deal performance, investor growth dynamics, funds raised, and manager performance.
To ensure convenient access to this data, we set up visualizations in Power BI.
The completed work gave the client a clear understanding of investor acquisition channel effectiveness and manager productivity. The Power BI visualization system simplified data analysis and enabled quick access to key insights for management decision-making.
Since this analysis was not sufficient for a rapidly growing investment business that requires a more flexible approach, we continued working with the client’s team on the next task — implementing RFM analysis.
RFM analysis is a customer segmentation method based on three parameters: recency (how recently a purchase was made), frequency (how often purchases are made), and monetary (the total amount spent).
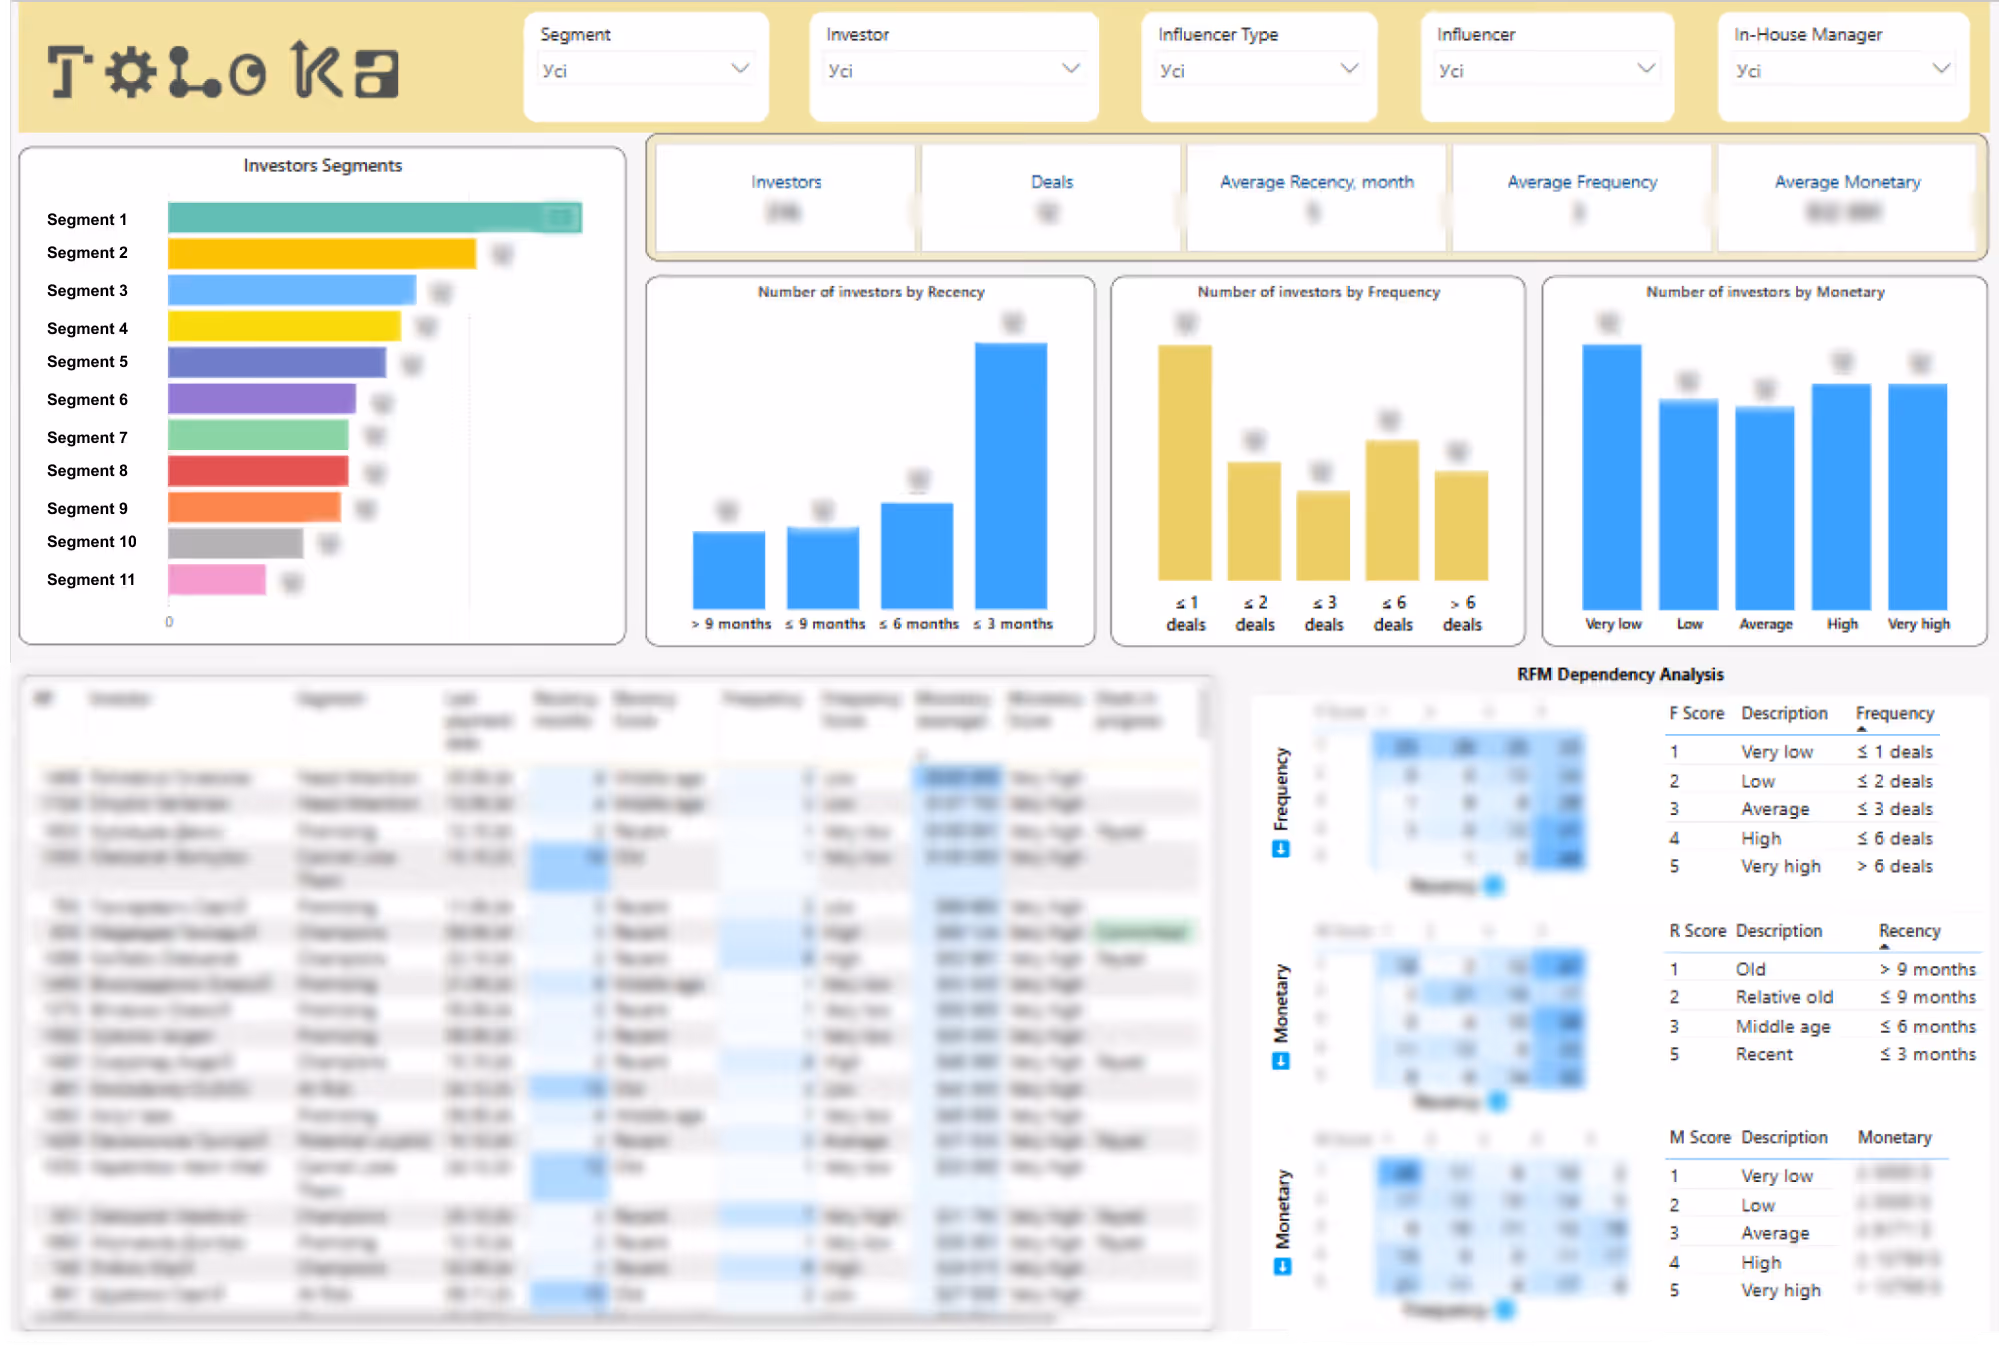
Classic RFM analysis is commonly used in eCommerce and banking, where customers are typically divided into 11 segments based on three key metrics:
Each client is assigned a score from 1 to 5 for each metric, and segmentation is determined by the combination of these scores.
Since the classic RFM model did not fully meet the client’s needs, we implemented a customized solution tailored to the specifics of the investment business.
To make segmentation clear and convenient for the client, we introduced two approaches:
Does your business need a reporting system?
Promodo has extensive experience building reporting and BI systems for fast-growing businesses.
In the Power BI visualization system, we created a table containing all unique investors, calculating the following for each:
For the financial metric, we chose the average investment amount rather than the total. This approach eliminates the influence of deal frequency while highlighting investors willing to take larger risks, regardless of the number of deals.
For the extended client segmentation (11 segments), we used percentiles — a method of dividing data into parts based on their actual distribution. This allowed us to make the analysis more precise and dynamic, automatically adapting to changes in the database.
How It Works in Practice
For each metric (Recency, Frequency, Monetary), investors are divided into groups according to activity level.
Example — Recency groups:
How Ratings Are Assigned
For each investor, the system automatically calculates scores based on their metrics.
For example, if an investor falls into the 75–100% Recency percentile, they receive a rating of 4. Ratings for Frequency and Monetary are assigned similarly.
Benefits for the Client
This created a clear logic and structure for grouping investors, taking into account the specifics of the investment business. Thanks to this, the client gained:
- A tool to prioritize interactions with different investor groups
- A flexible analysis approach that adapts to business changes
- A clear foundation for planning marketing activities
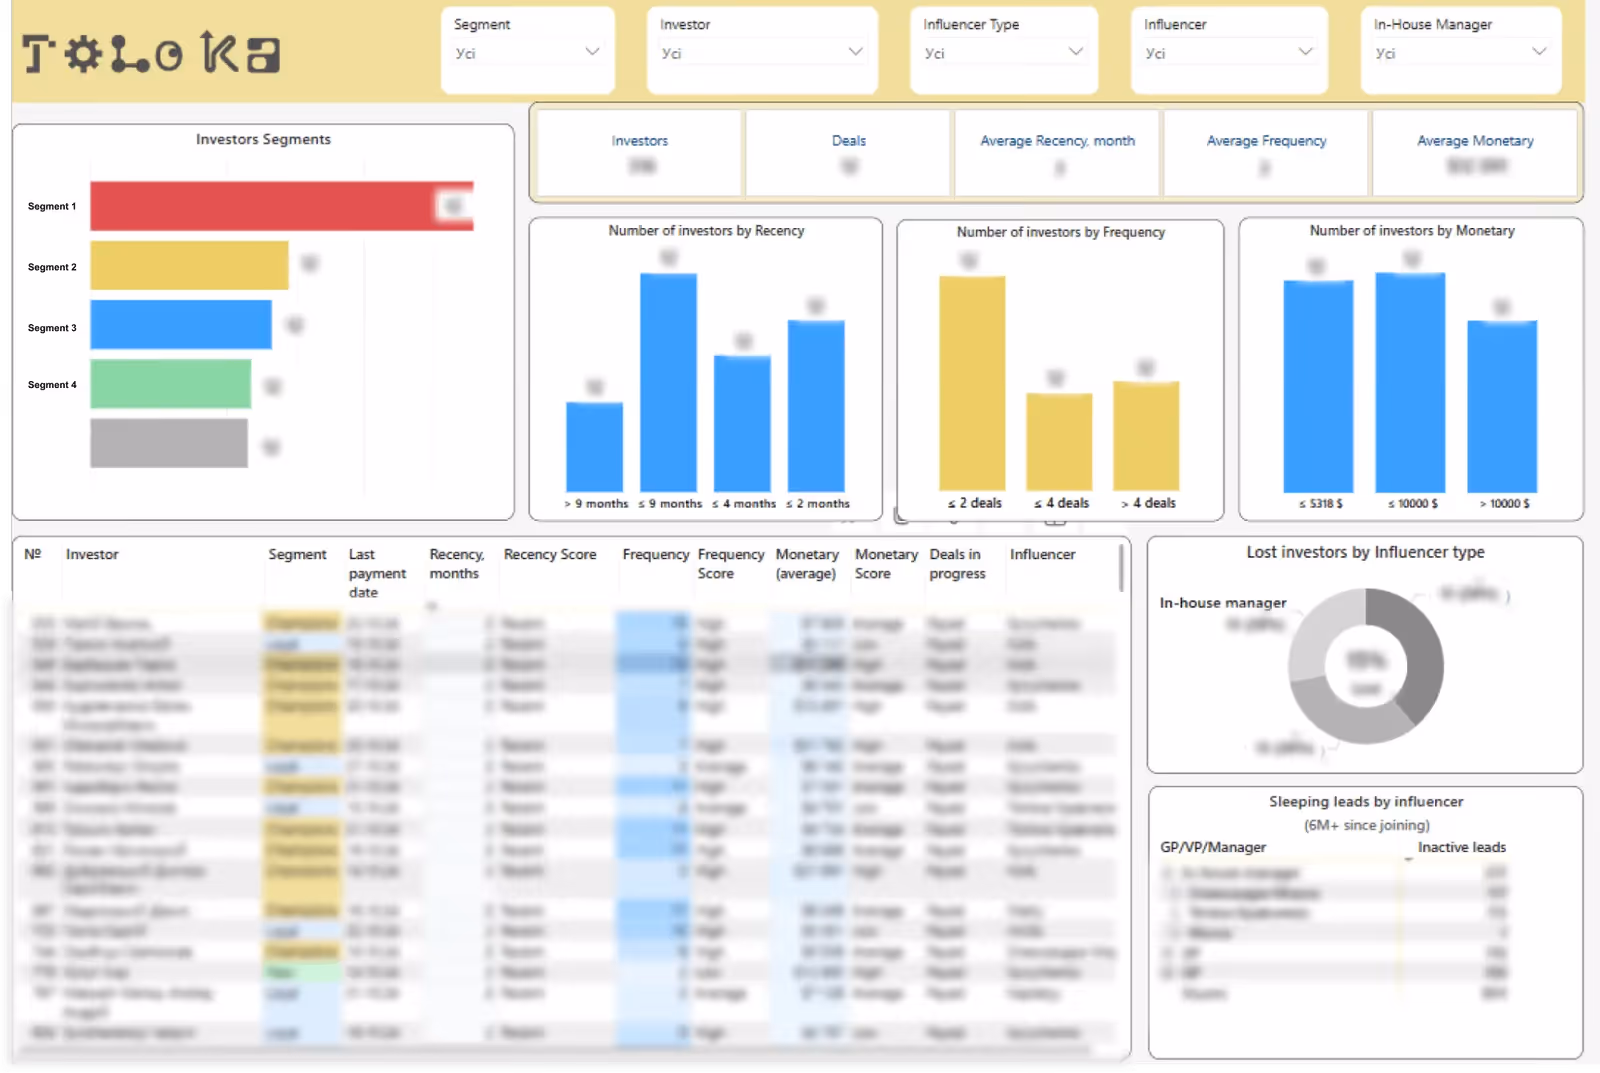
After assigning scores for each of the three metrics (R, F, M), we divided investors into five main groups based on specific logic, for example:
This approach allows Toloka to identify the most active investors, develop personalized marketing strategies, and set up targeted communication for each group, combining the simplicity of the simplified analysis with the depth of the classic RFM model.
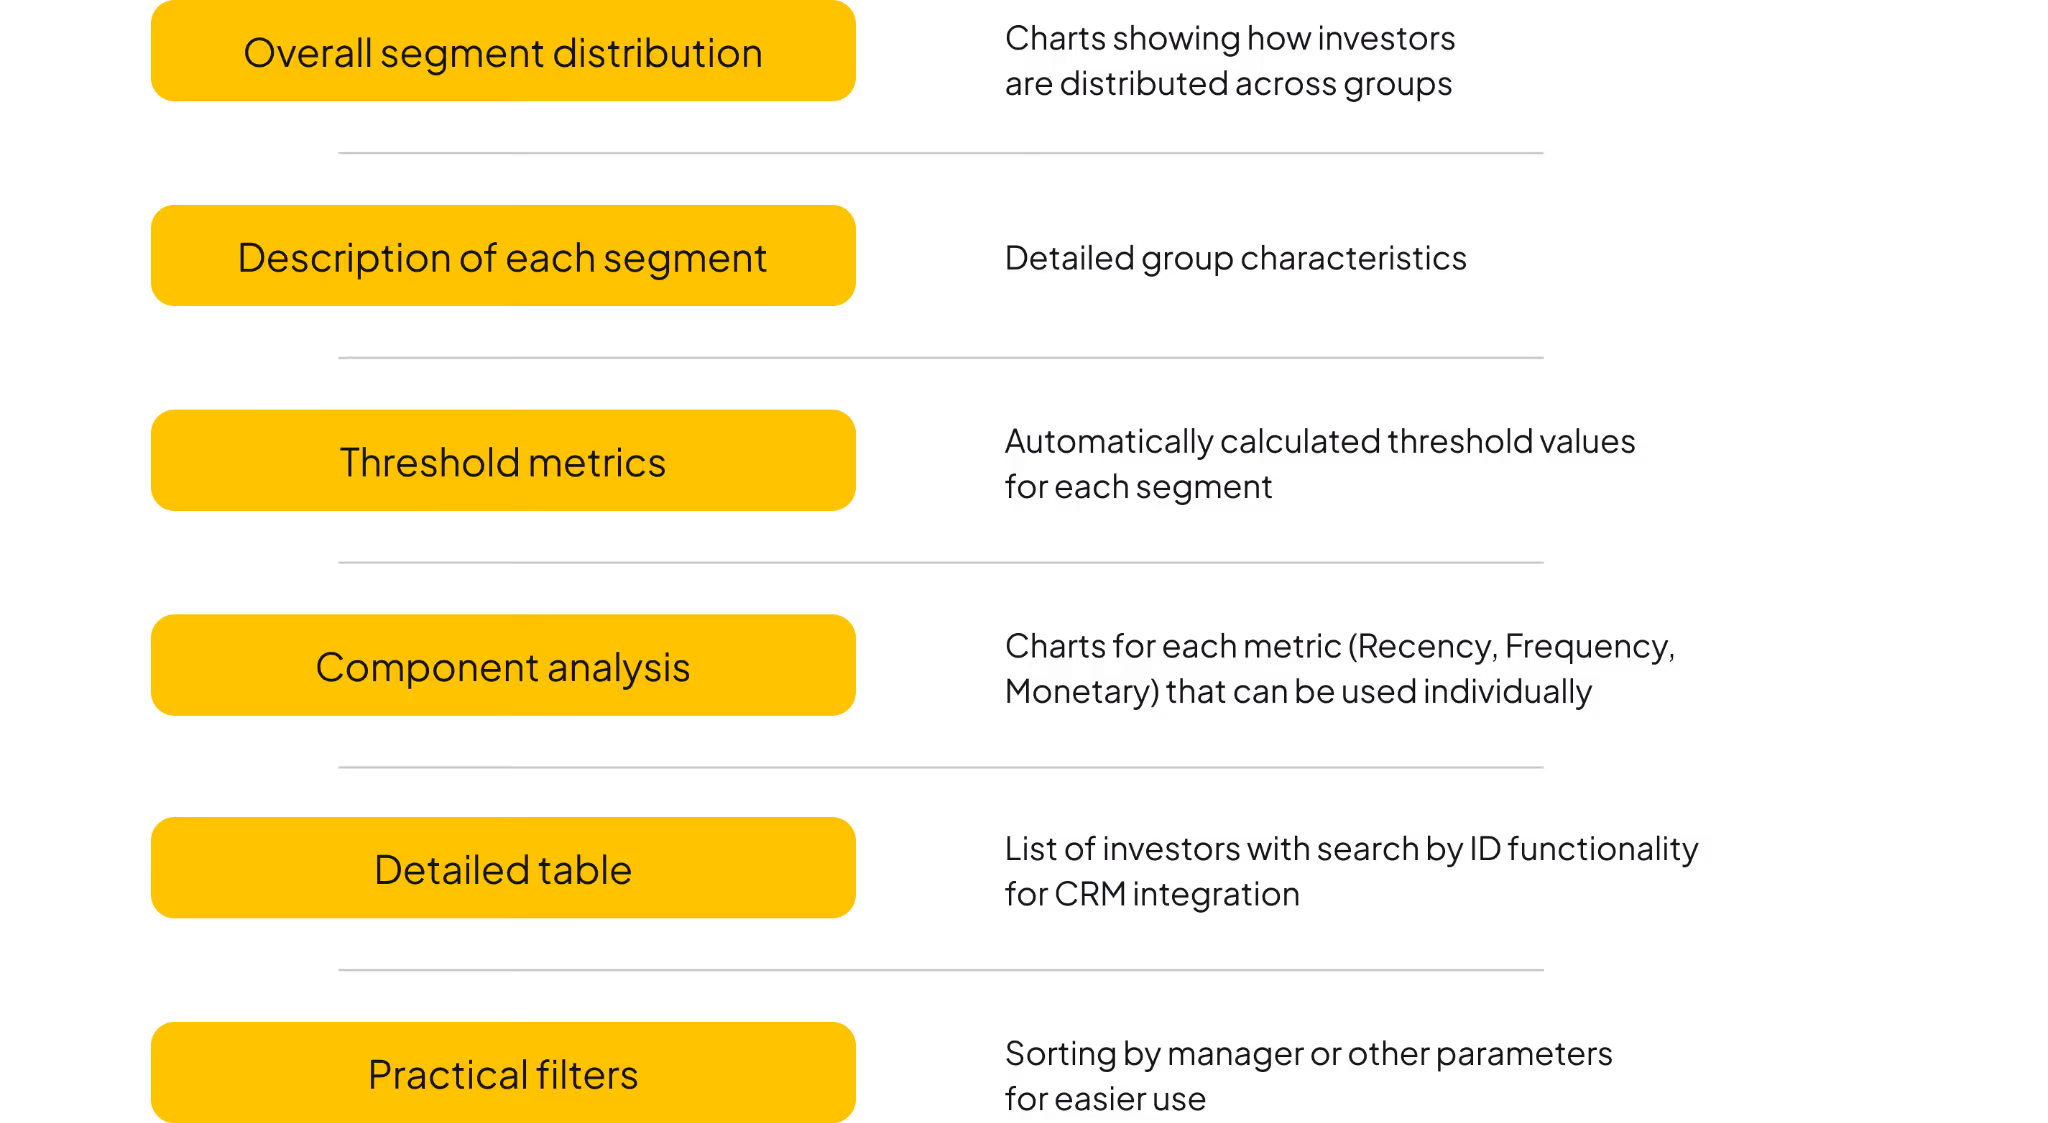
We created an interactive report with two segmentation versions — Lite and Classic, which includes:
The implemented solution allows Toloka to quickly analyze the investor database, adapt strategies for different segments, and easily integrate data into business processes.
To ensure reliable data storage and maintain data integrity, we automated the process of transferring information from Notion to the BigQuery cloud storage.
This step eliminated manual intervention, reduced the risk of data loss, and created a reliable foundation for further analysis.
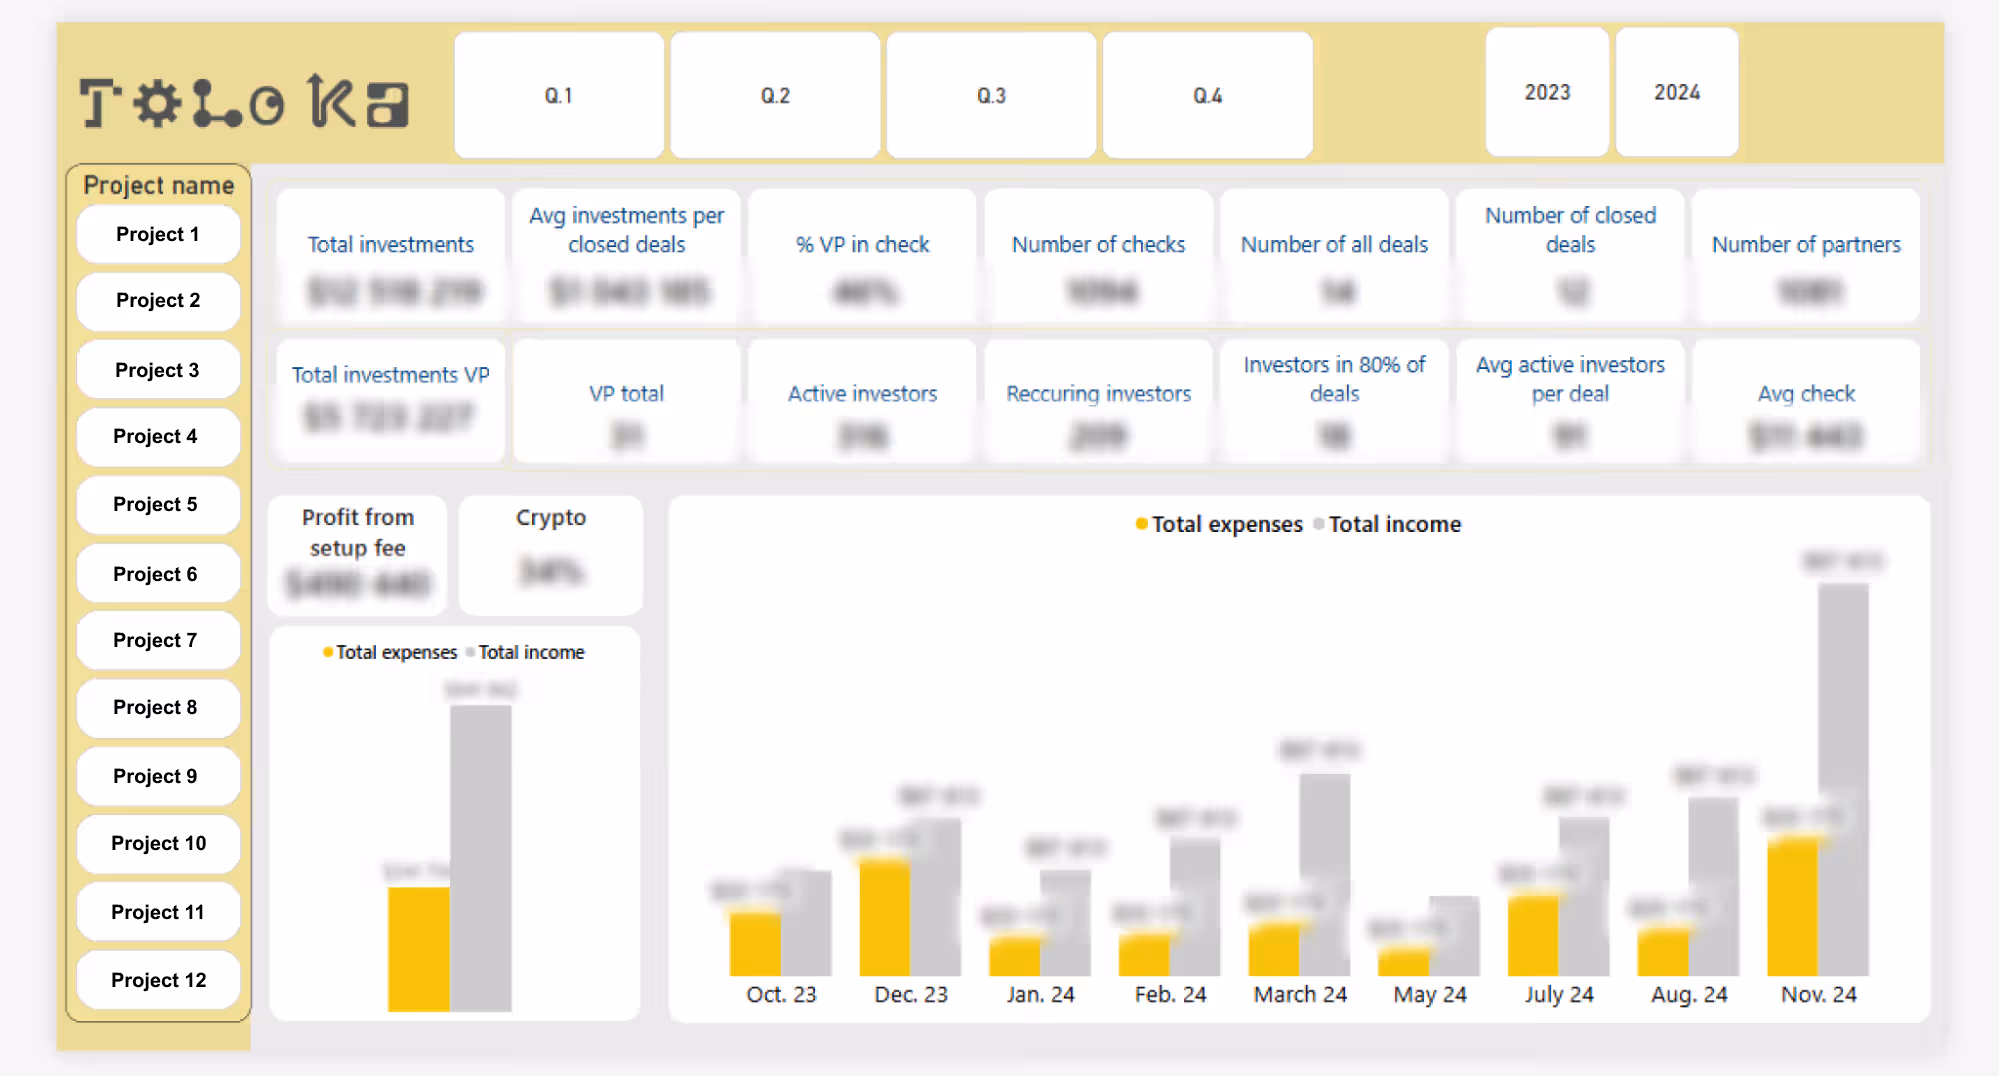
The BI reports we created became the primary tool for monitoring key business metrics. The client can now easily track the number of open and closed deals, total investments, average investment size, expenses, profit, as well as the performance of managers and partners responsible for investor acquisition. This allows them to make fast, well-informed management decisions based on up-to-date data.
A particularly important feature is the ability to analyze key metrics both at the level of individual deals and over time. This helped the client better understand their business performance and make informed decisions based on current data.
For convenience, we developed a dynamic rating for each investor that reflects their current behavior, ensuring transparency and clarity in the segmentation process.
Special attention was given to interpreting each segment and defining its role within the client’s business. This provided the client with an effective tool for managing investor loyalty, creating targeted communication, and optimizing marketing strategies.
Thanks to the integration of segments into reporting, the client can quickly analyze the investor database, leverage data in real business processes, and generate key insights for ongoing investor engagement.
[[SLIDER-START]]
[[SLIDER-END]]
The current state of analytical data already allows Toloka’s personal managers to work with individual investor segments. The RFM analysis has become the foundation for activating previously inactive partners, increasing their activity by over 15%. This, in turn, has significantly raised the investment check per project within the Toloka syndicate, which, since the end of 2024, averages $1.5 million.
This approach also significantly reduces the time personal managers spend communicating with syndicate partners. The continual growth in the number of participants has minimal impact on communication and onboarding efforts.
Additionally, the Promodo analytics team is already developing additional tools for analyzing new data, which will help track investor interaction dynamics and optimize strategies for personalized communication.
Case studies
Check out how we help companies like yours overcome challenges and rise to the next level.

Number of leads
Cost per click decrease
Work Period

.avif)
of keyword rankings in TOP-3
Work period
.avif)


.webp)


