Content


PR & Marketing Manager at Promodo
I am a former journalist and an ardent follower of the "Cut to the chase" principle.
Together with Promodo's marketing team, I tell about the most interesting things in the world of Ukrainian digital. No stories of successful success – only tips, figures, and working case studies from the leading performance marketing agency. By the way, I talk about our failures as well.

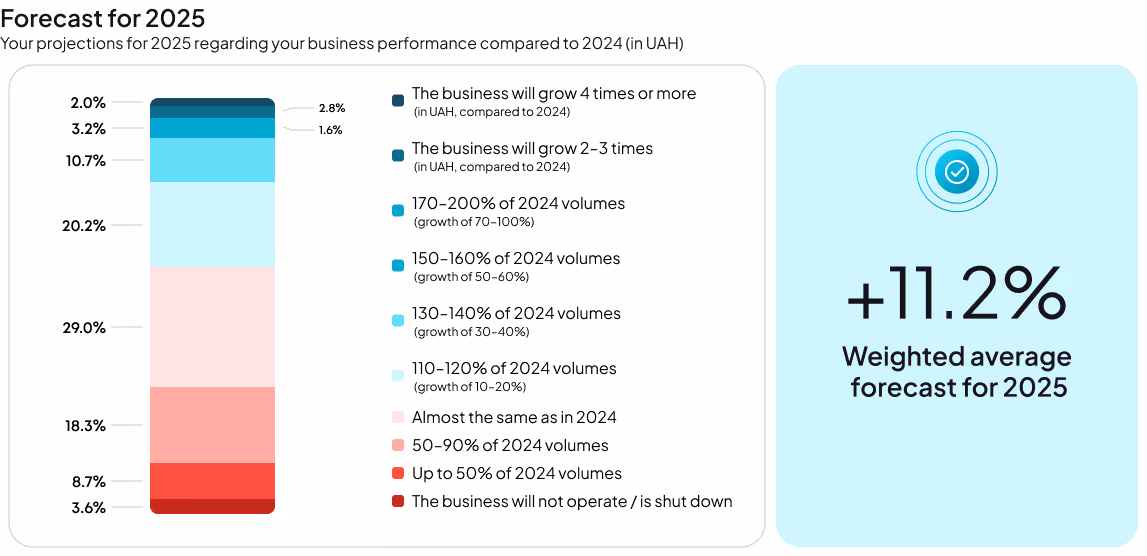
Ukrainian entrepreneurs are actively exploring new markets and implementing digital solutions to optimize their processes. According to a recent survey, businesses plan to increase their revenue by 11% in 2025 compared to 2024.
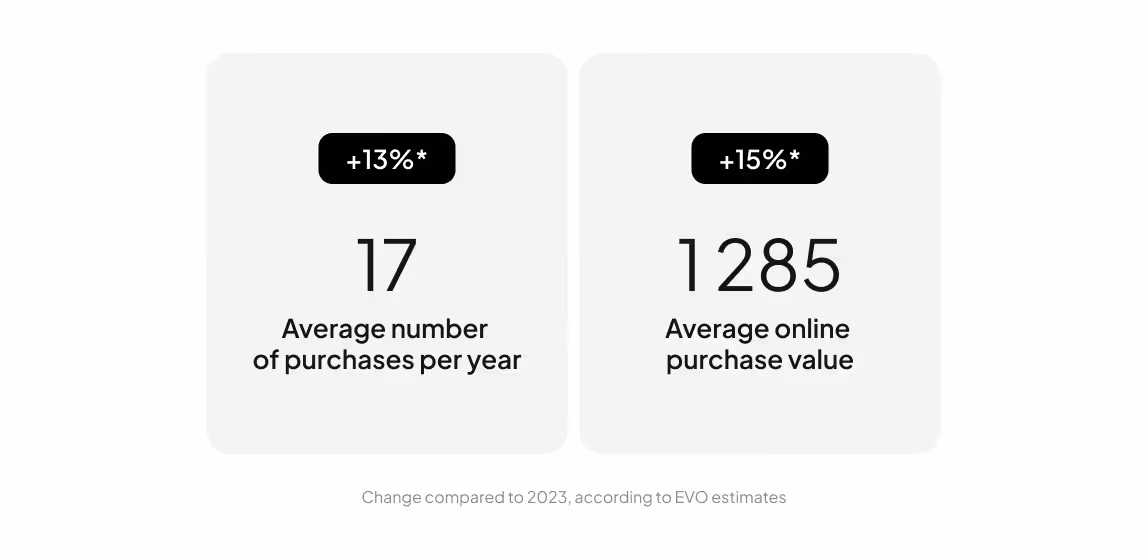
To recap, in 2024, the total amount Ukrainians spent on online shopping grew by 25%, reaching 239 billion UAH. Last year, 60% of all online purchases were made via mobile phones.
In this report, we visualized trends across seven market niches using weighted average indicators within each category. The sample includes businesses with varying revenue levels. We compared data from the first half of 2025 with the same period in 2024. To account for seasonality and neutralize inflation impact, some figures are presented as percentages in USD.

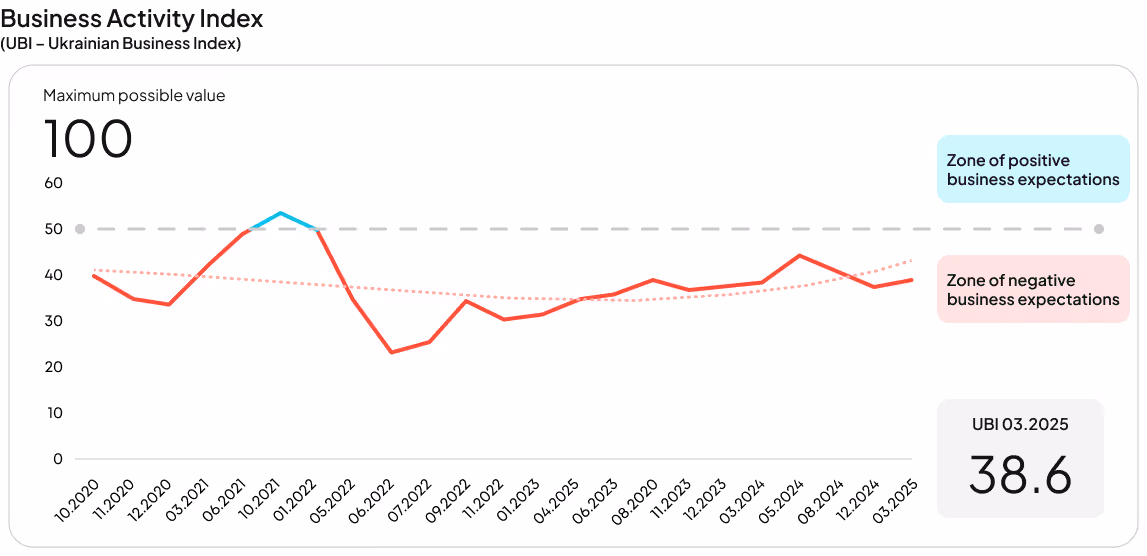
As of March 2025, the Ukrainian Business Activity Index stands at 38.6 out of a possible 100 points. It has increased compared to the January figures but remains in the zone of negative expectations and is lower than the figure recorded in May 2024 (43.7).
The growth drivers of the index over the first three months were an increase in the number of orders. Specifically, 19% of companies reported that sales had increased compared to the previous period, while 31% of respondents indicated that their sales level remained the same.
[[SLIDER-START]]
[[SLIDER-END]]
Delivery costs, which can reach 15–20% of the product price, remain the biggest barrier to online purchases. Reducing these costs by opening own pickup points and forming strategic partnerships with logistics providers is a key challenge for market players.
Convenient deferred payment options and credit plans boost sales of both high-value and everyday goods. At the same time, trust in online payments—reinforced by brands like RozetkaPay, Prom-oplata, and OLX Delivery—helps build consumer habits and encourages repeat purchases.
In 2024, the Chinese giant Temu entered the market aggressively with low-quality, low-priced products. Massive investments in advertising and free delivery enabled it to quickly gain market share. For Ukrainian players, competing with Chinese companies is extremely challenging, particularly due to unequal tax conditions.
The charts visualize weighted average indicators across each category. The sample includes players with varying turnover levels. The comparison was made between the first half of 2025 and the figures from 2024.
[[SLIDER-START]]
[[SLIDER-END]]
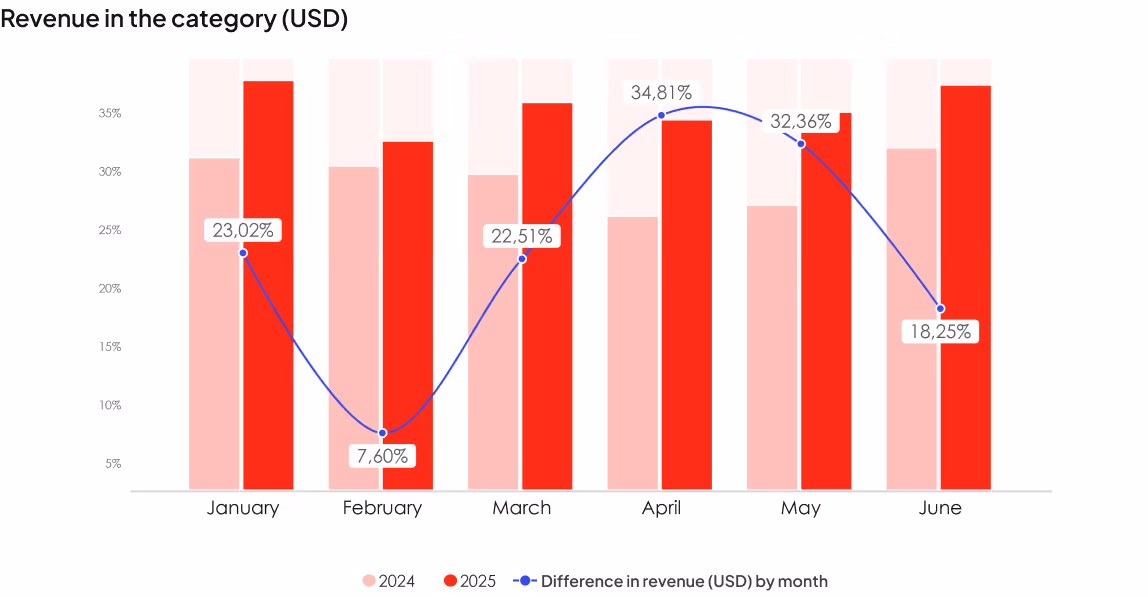
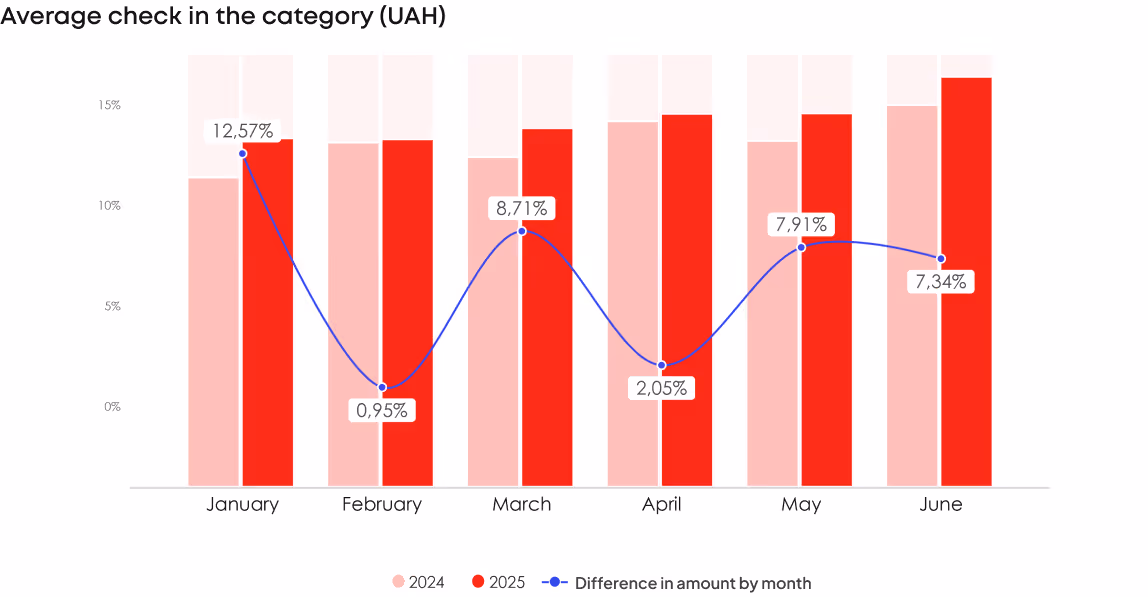
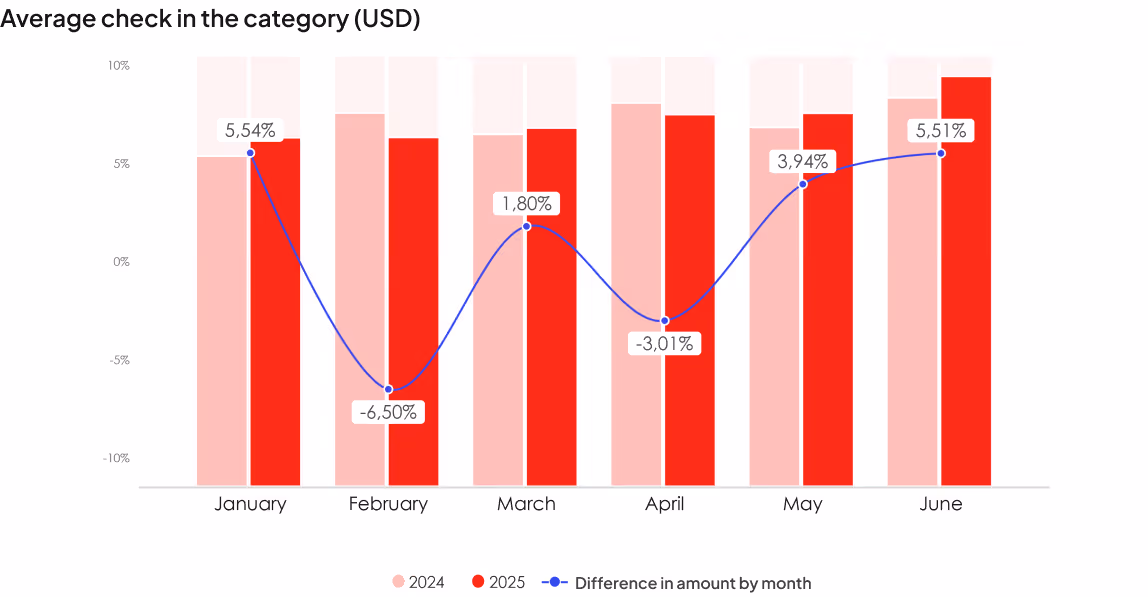
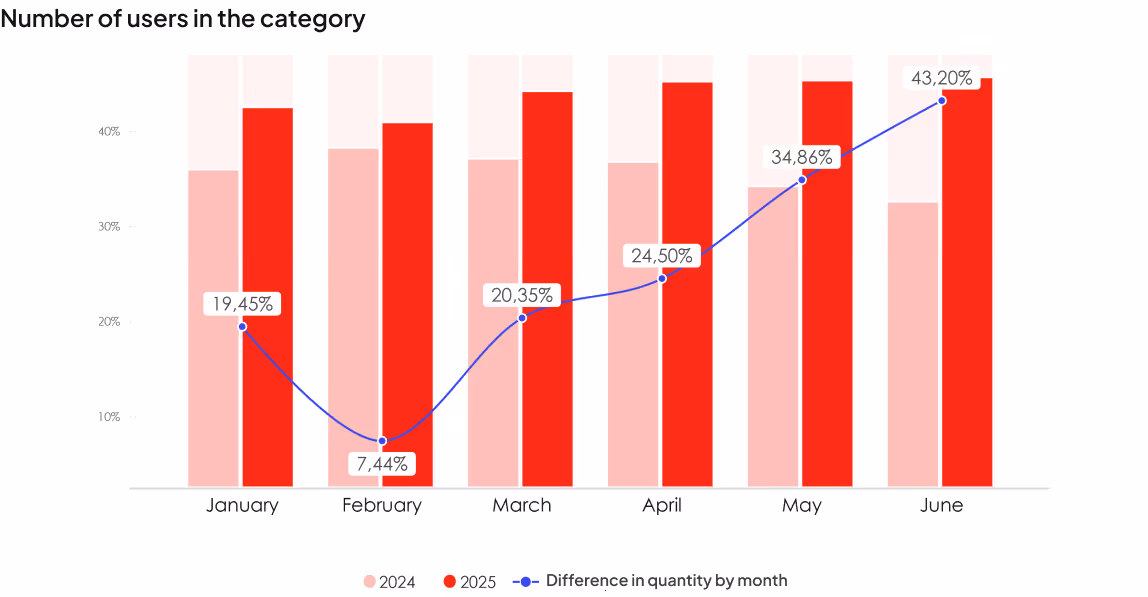
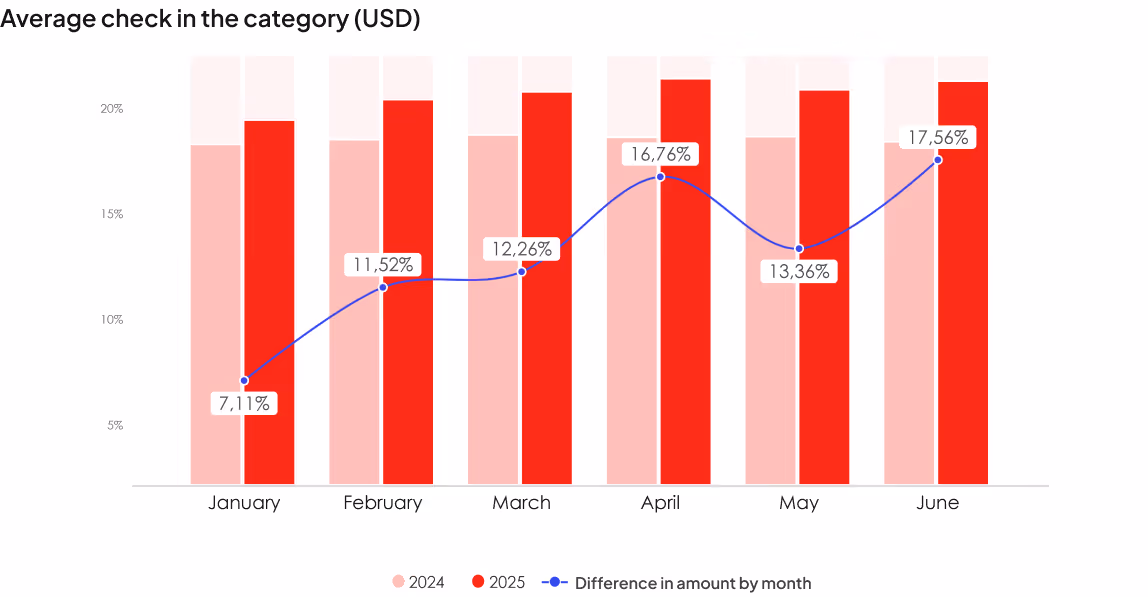
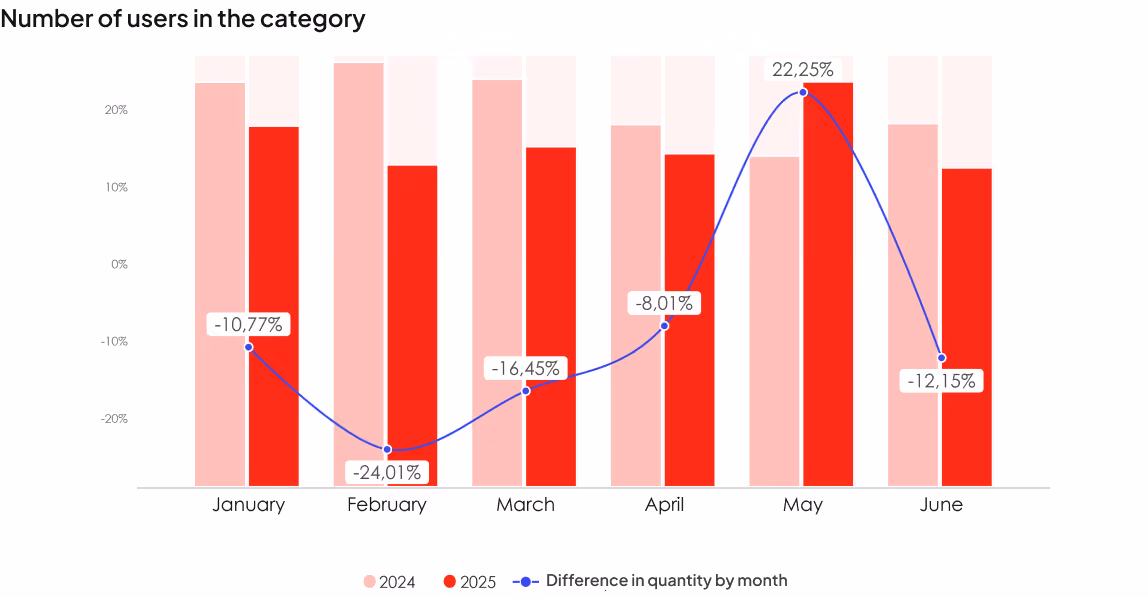
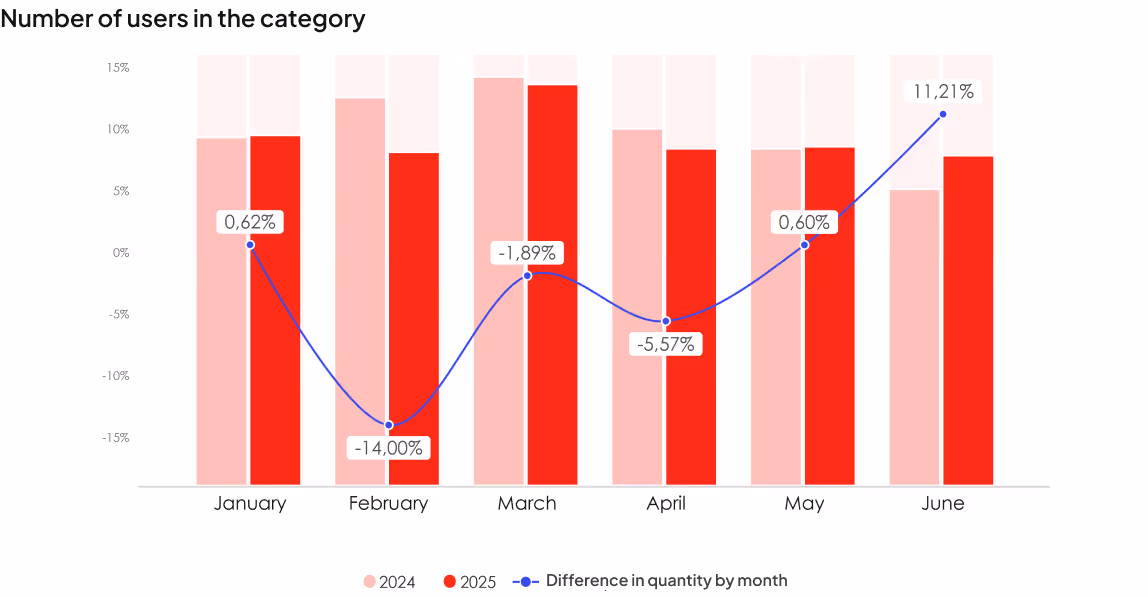
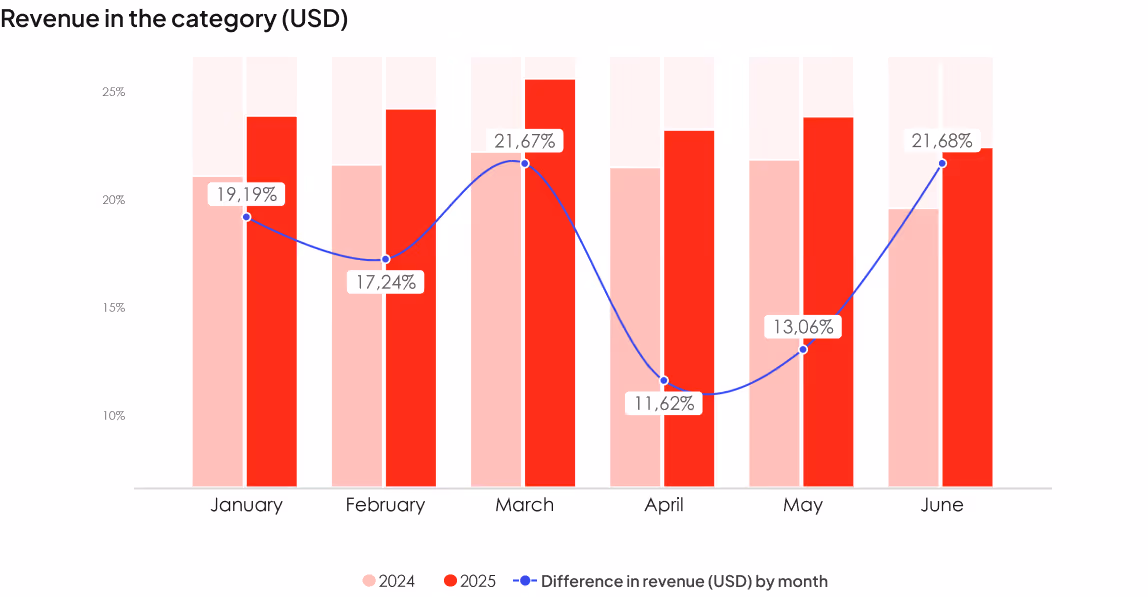
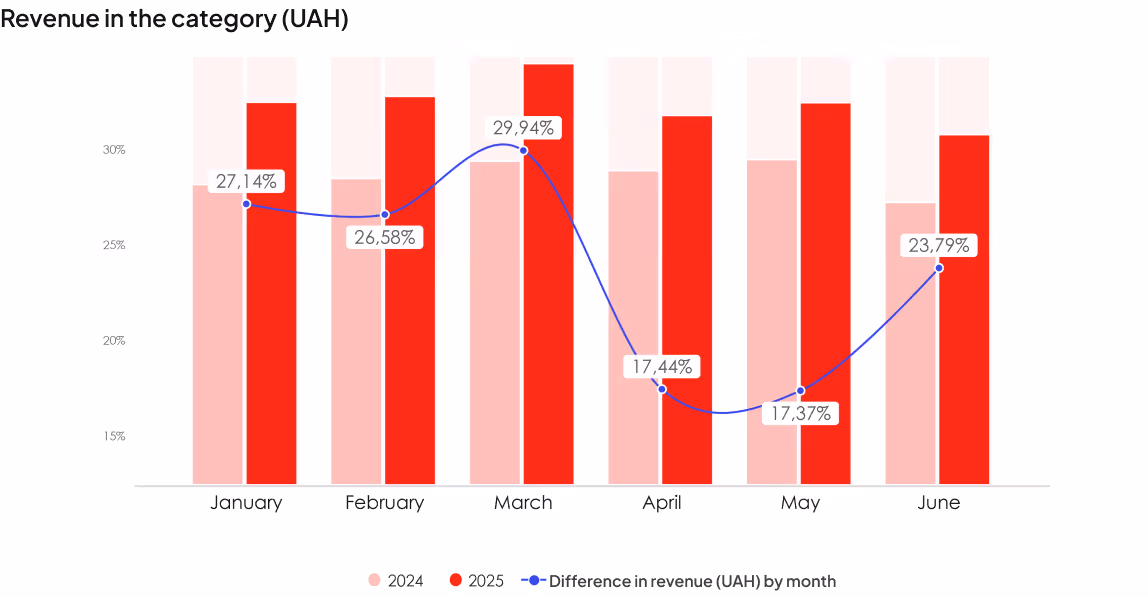
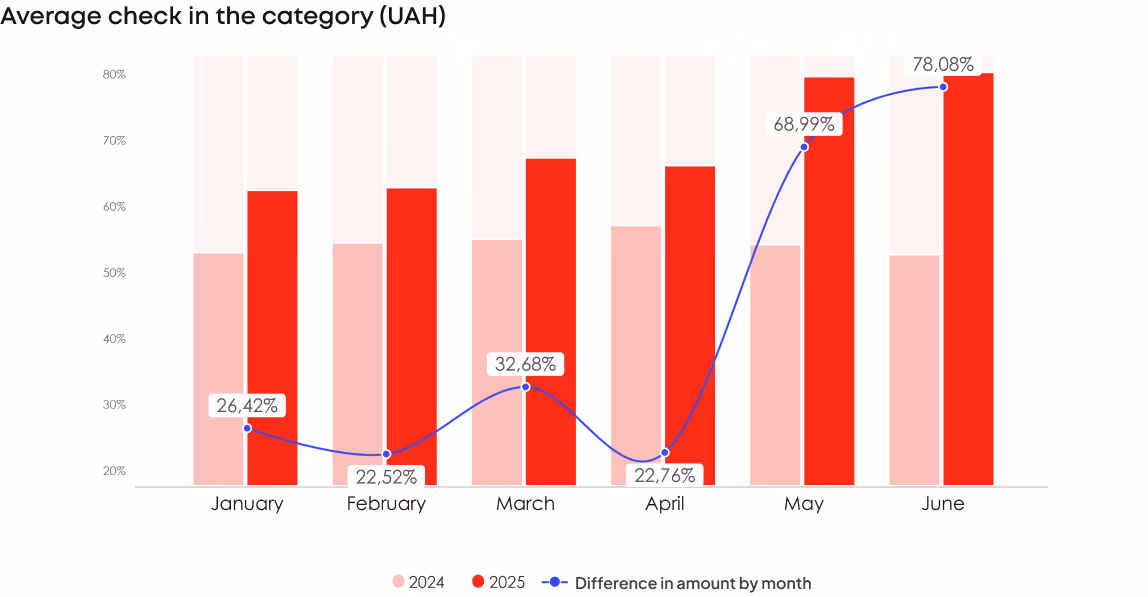
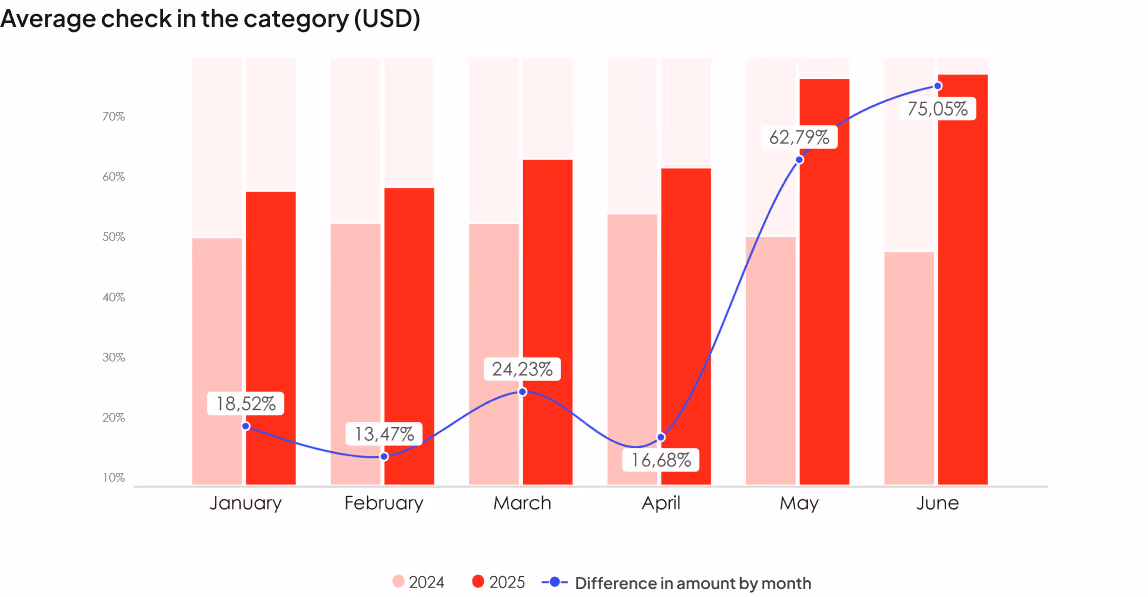
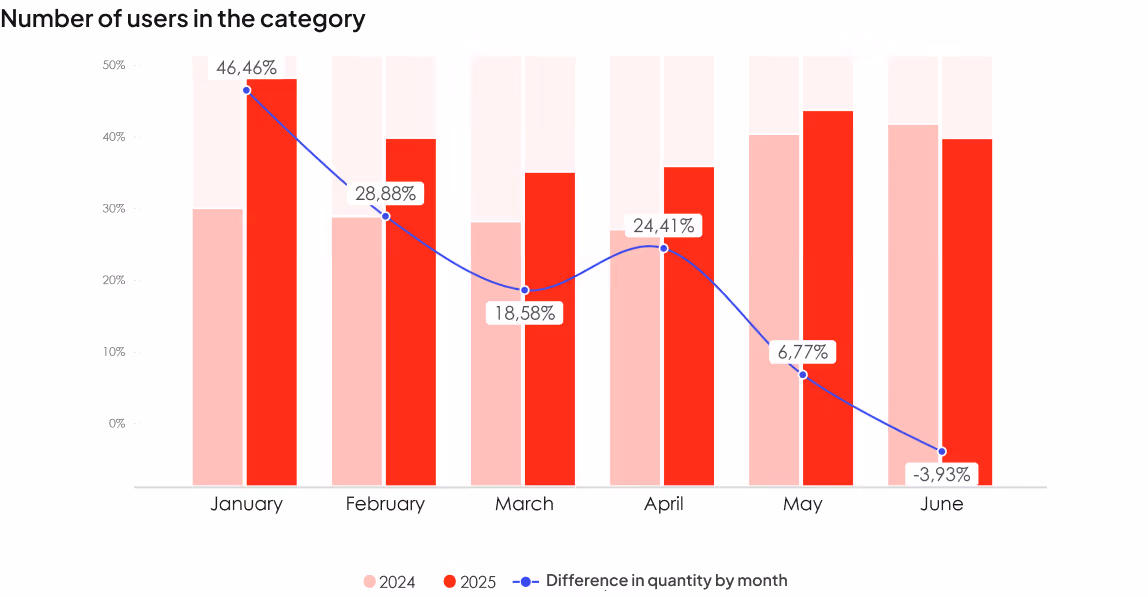
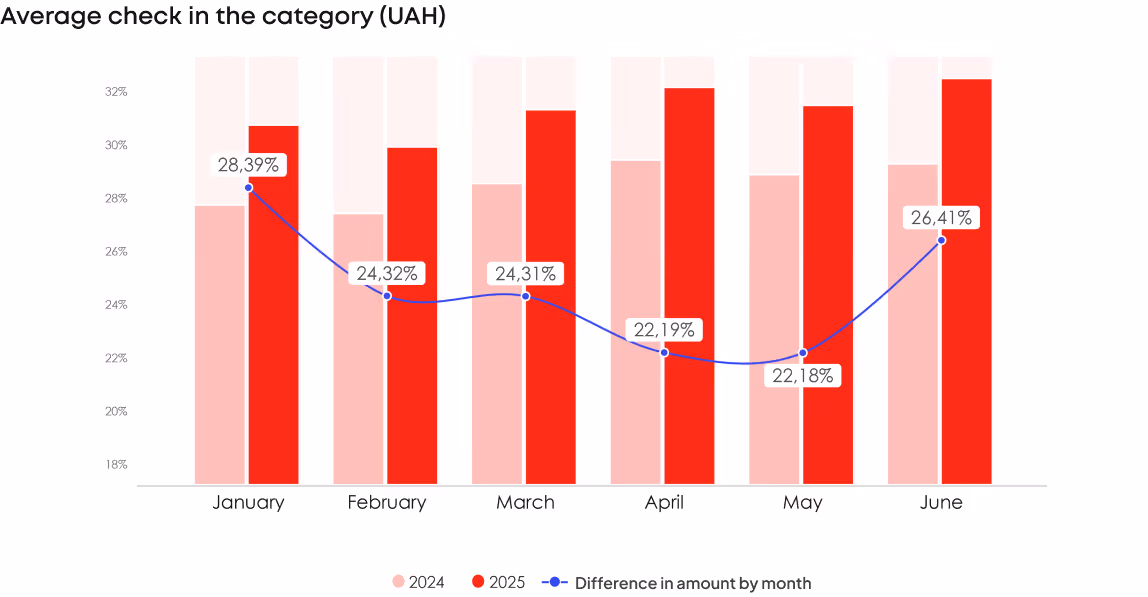
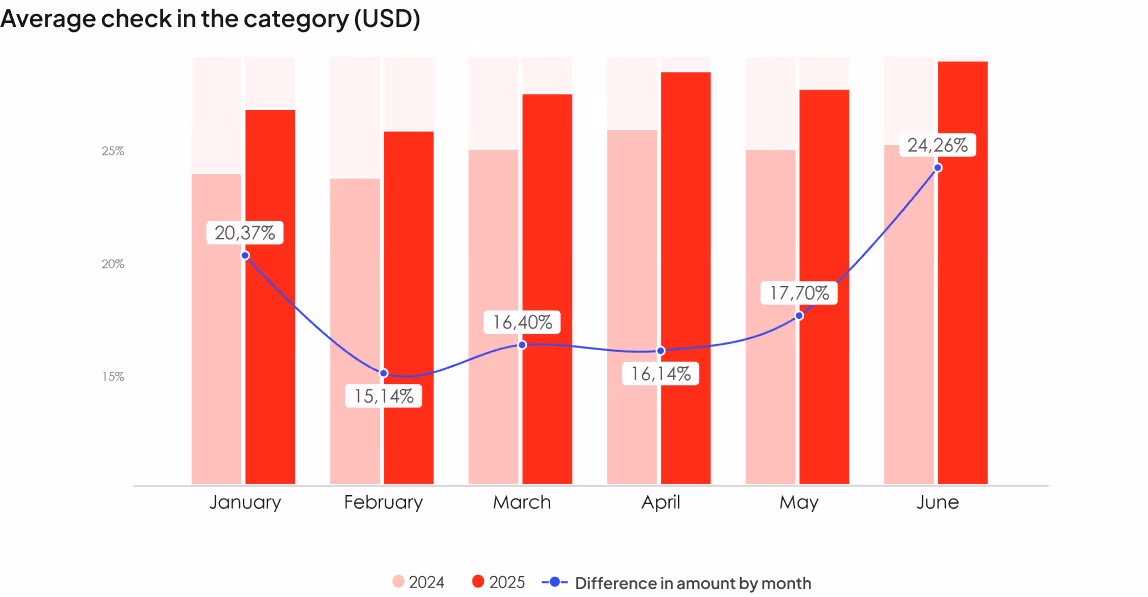
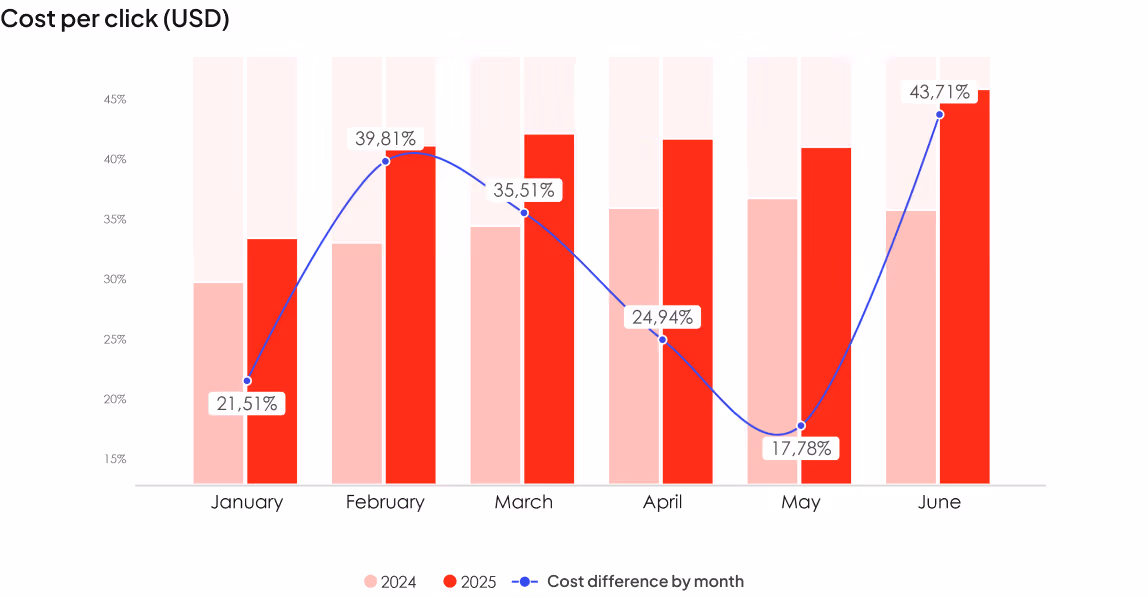
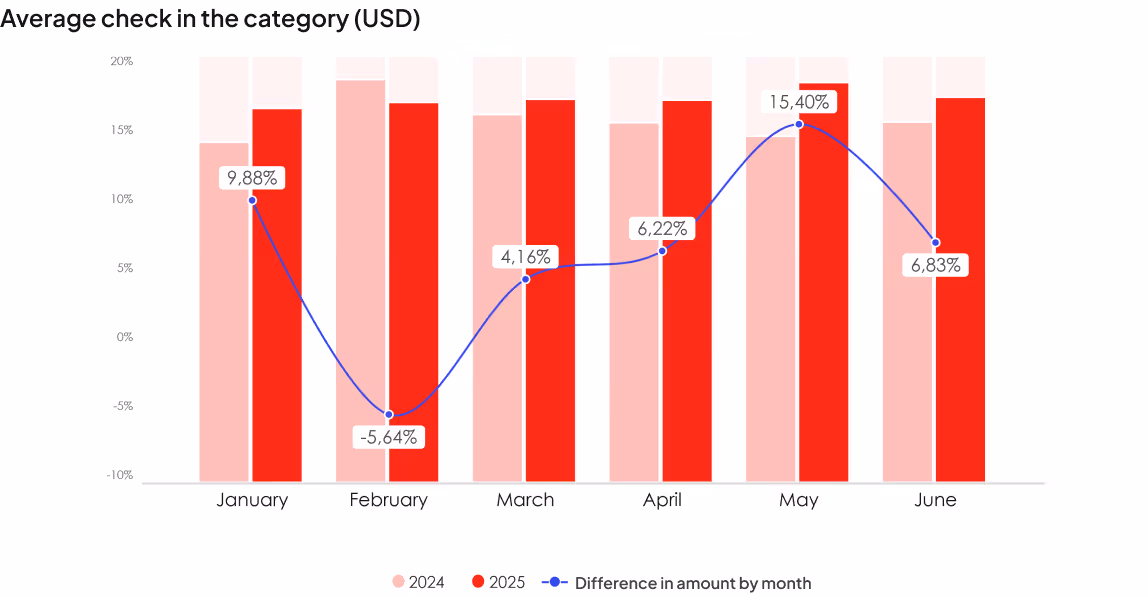
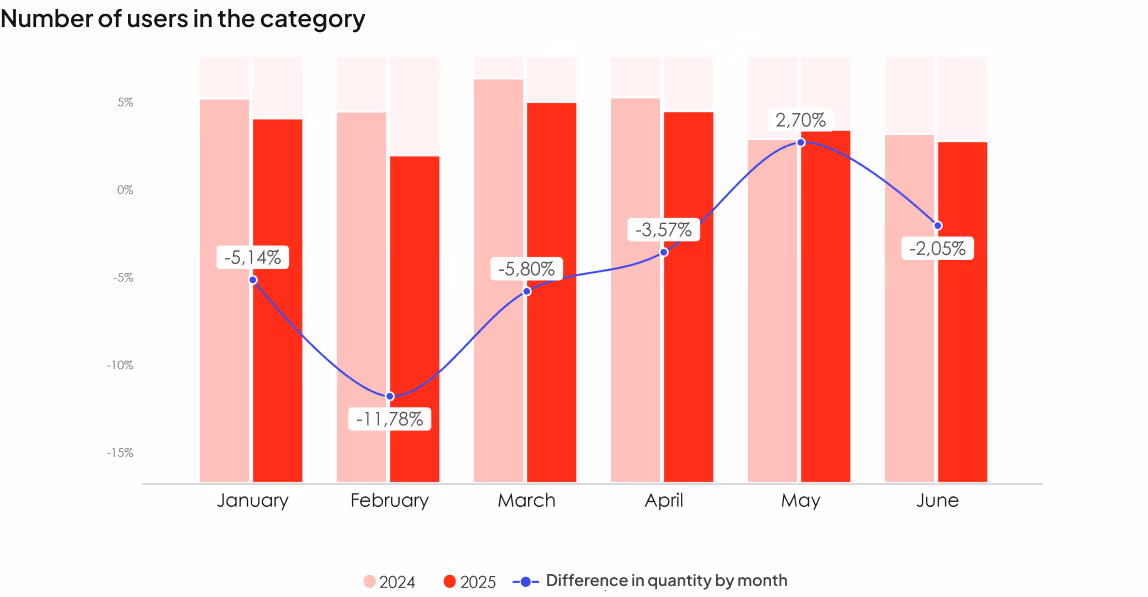
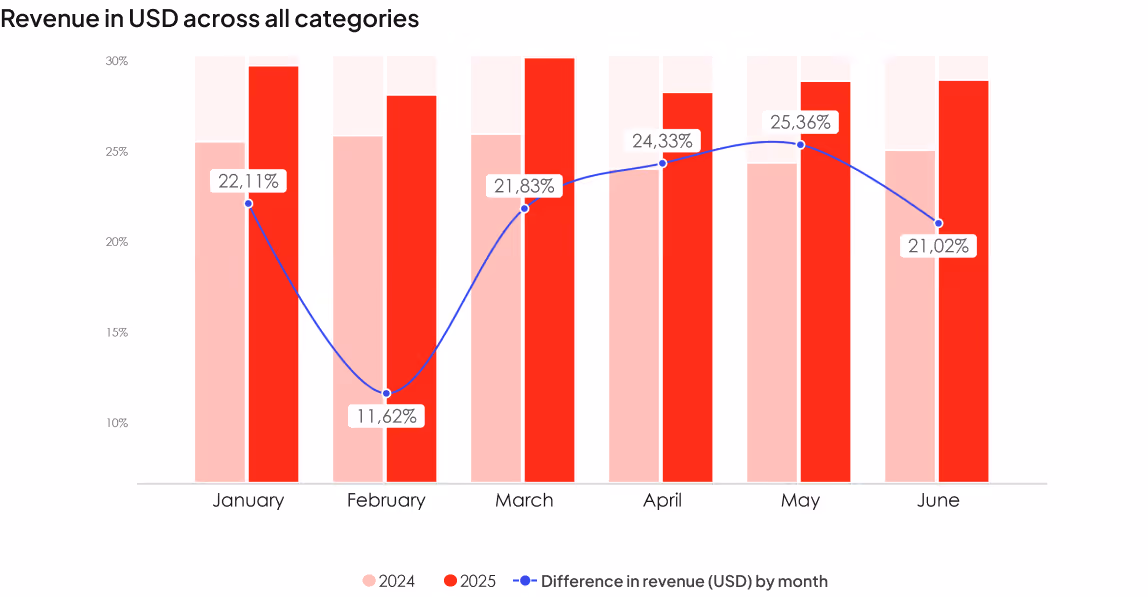
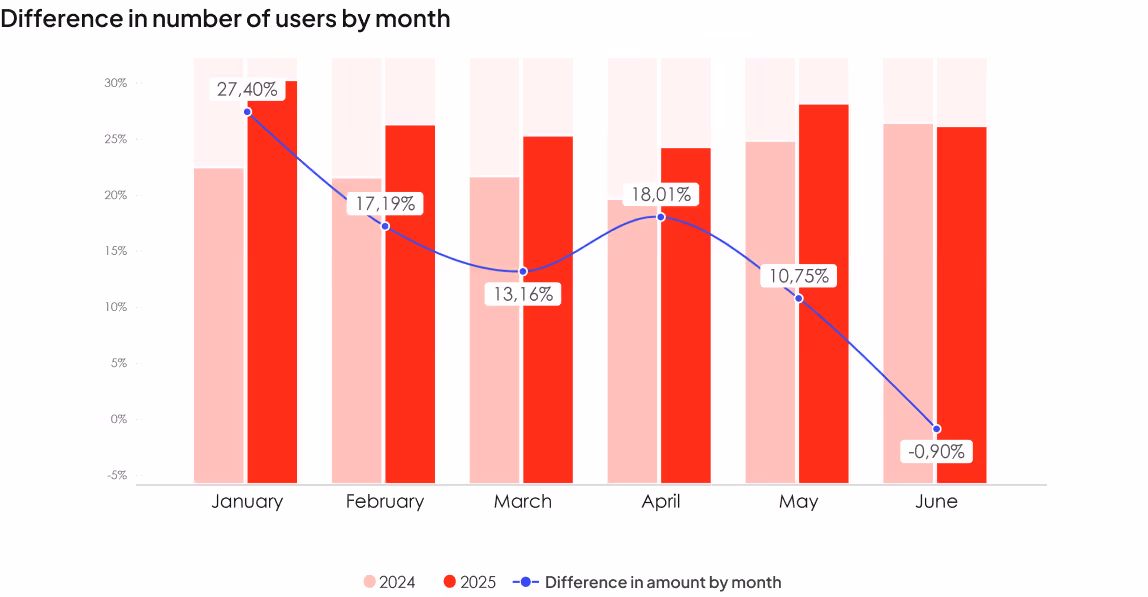
Compared to the first half of 2024, the profitability of this consumer electronics industry increased by 29% in UAH and by 23% in USD. However, this growth was not driven by a higher average check, but rather by an increase in the number of purchases and the conversion rate. The latter rose by 7%.
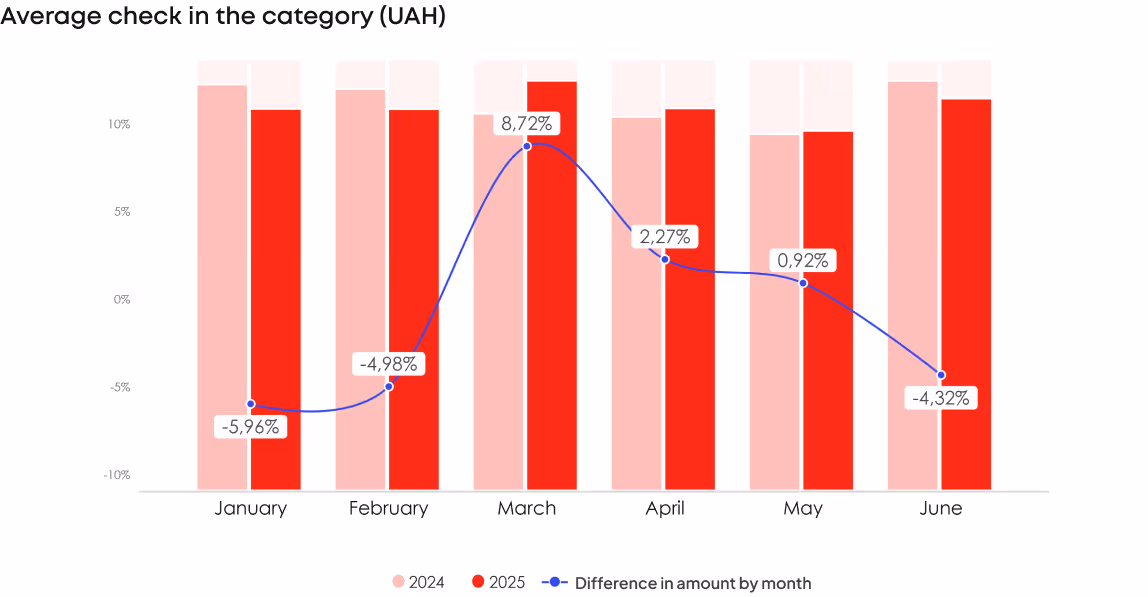
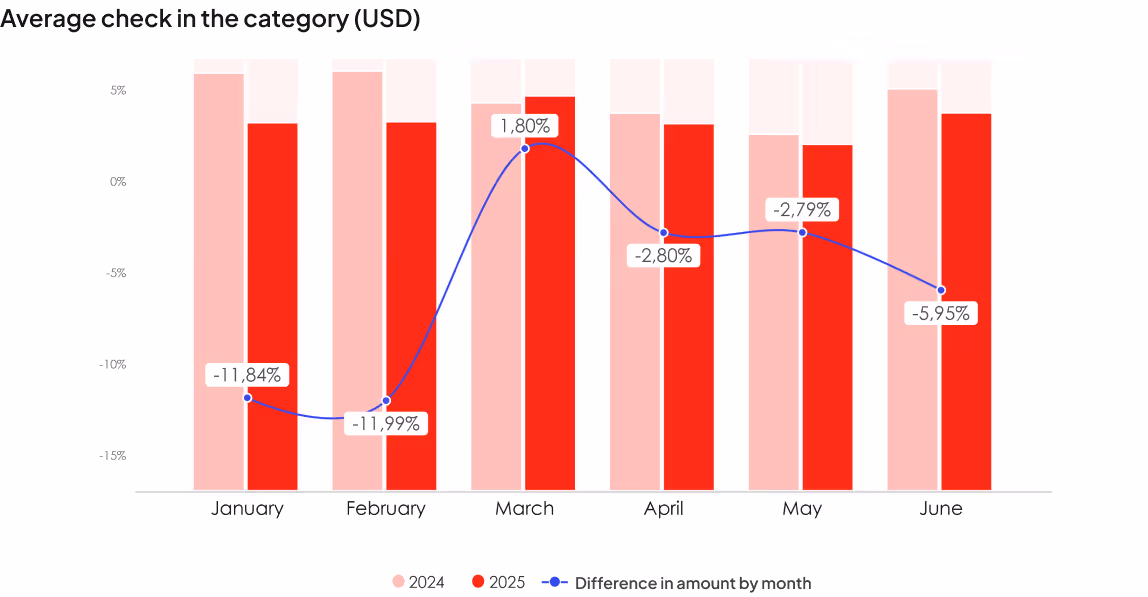
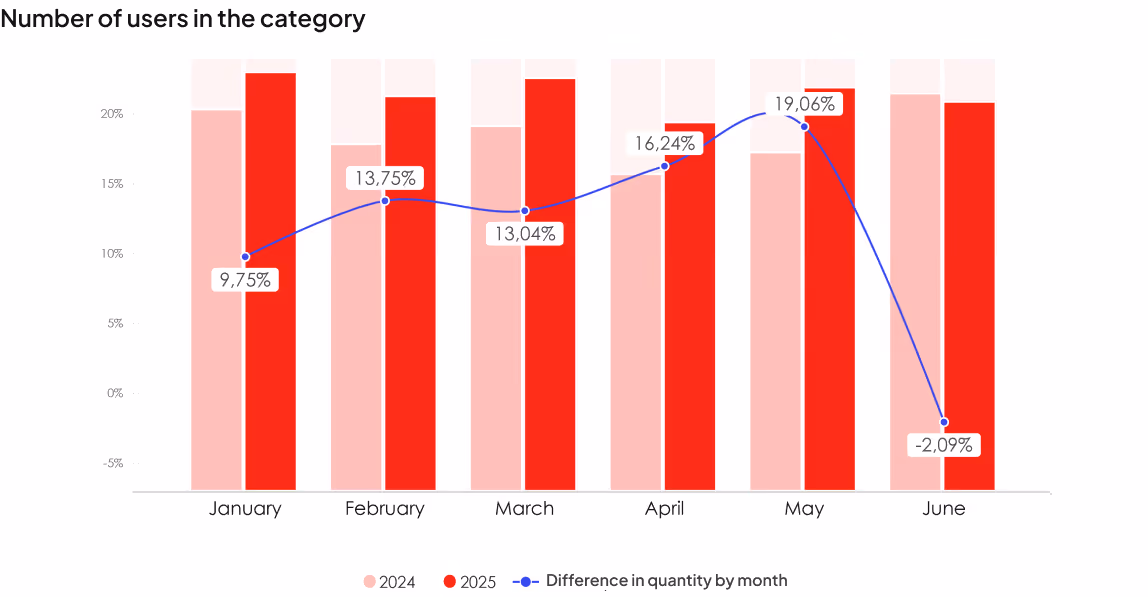
The number of purchases also grew — by 19%, with a dip observed only in February. The decline in the average check in UAH is no longer as steep as it was in the second half of 2024 (30%) — it has almost stabilized. In March 2025, the average check even exceeded last year’s figures.
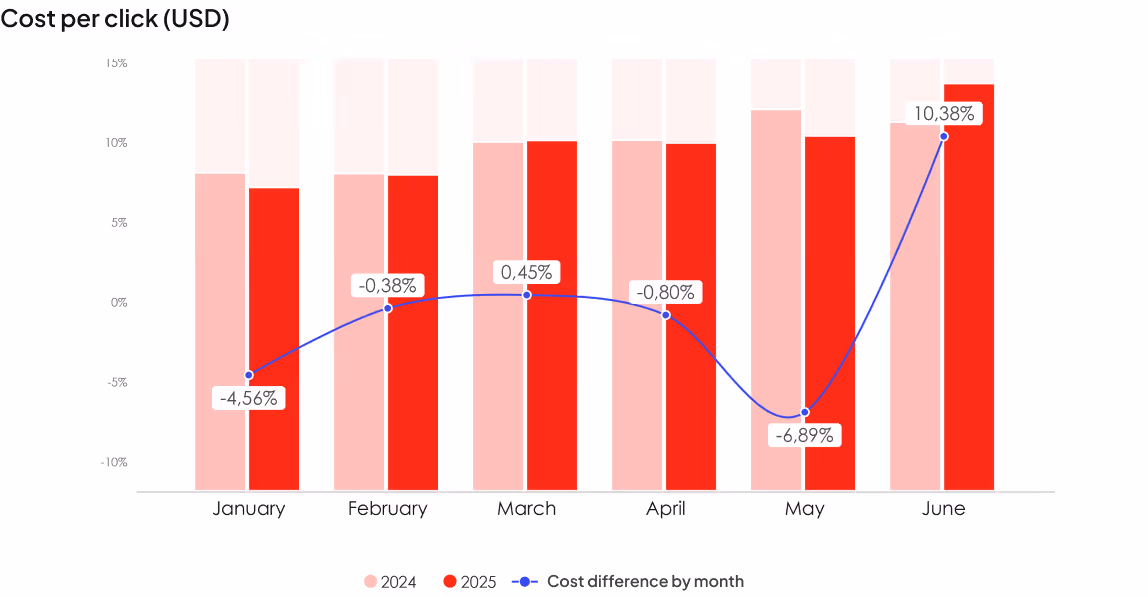
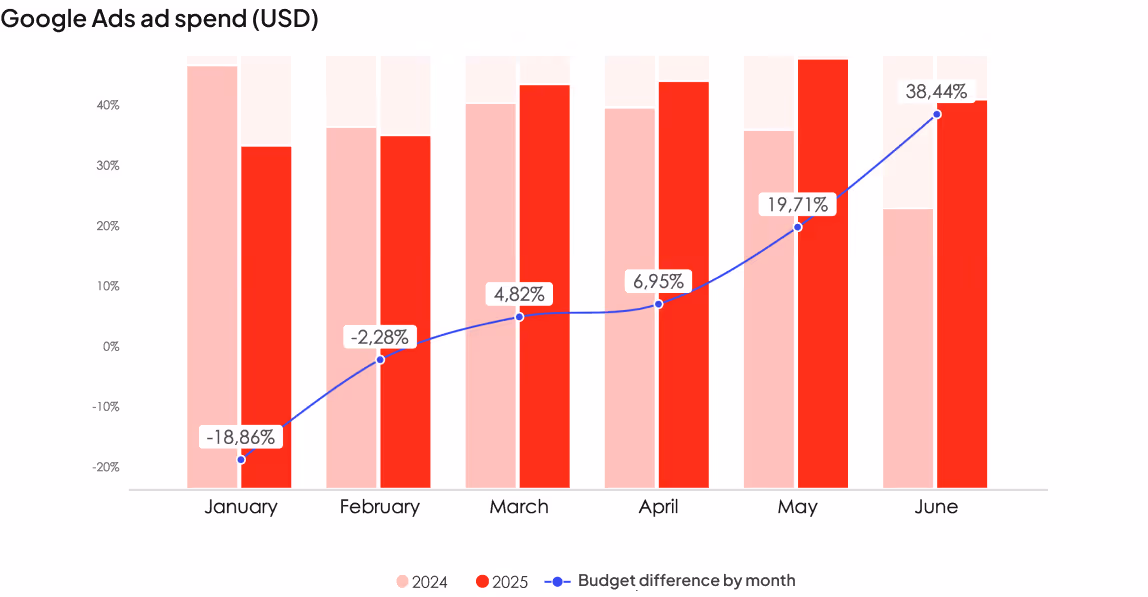
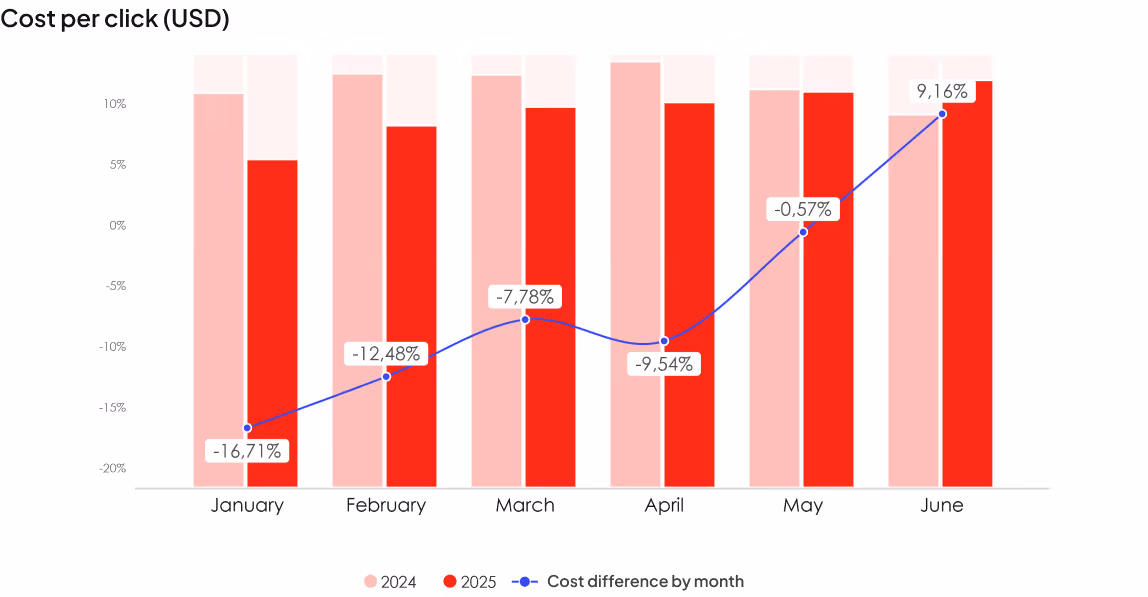
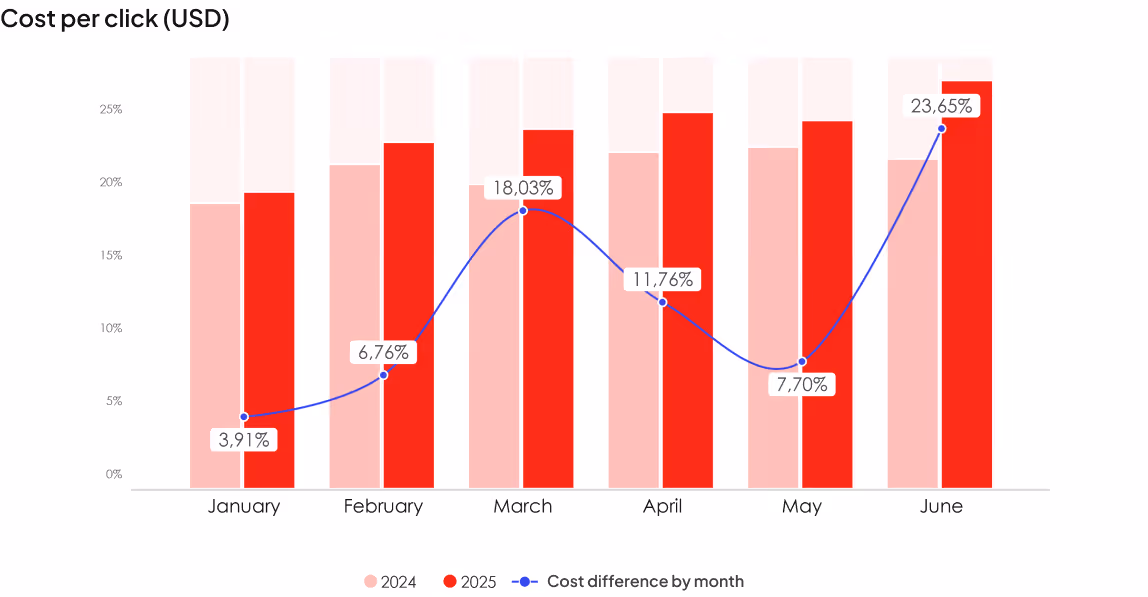
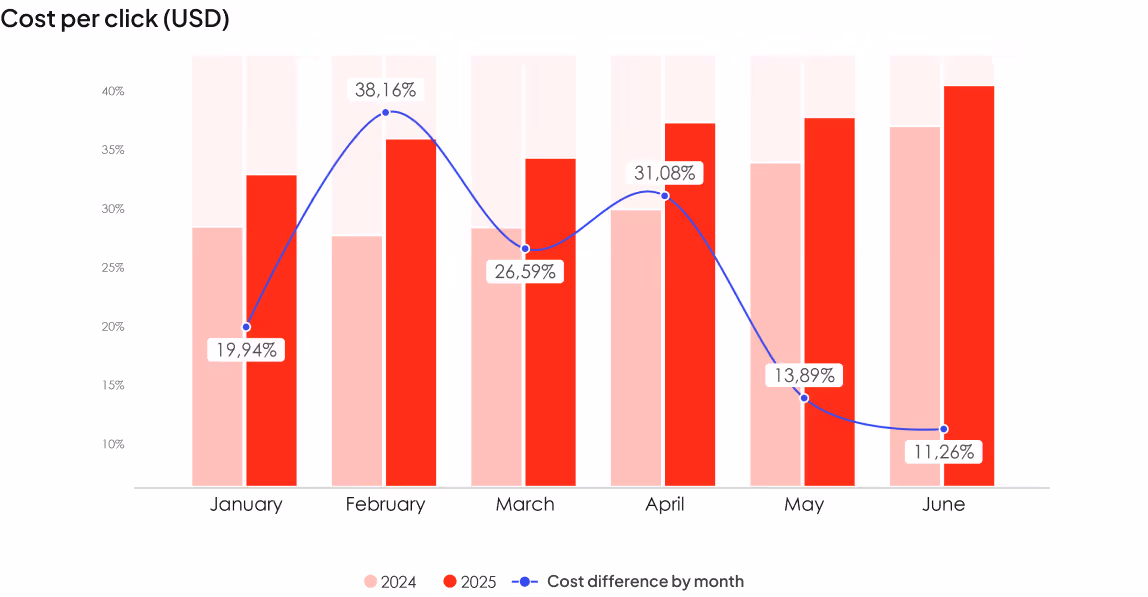
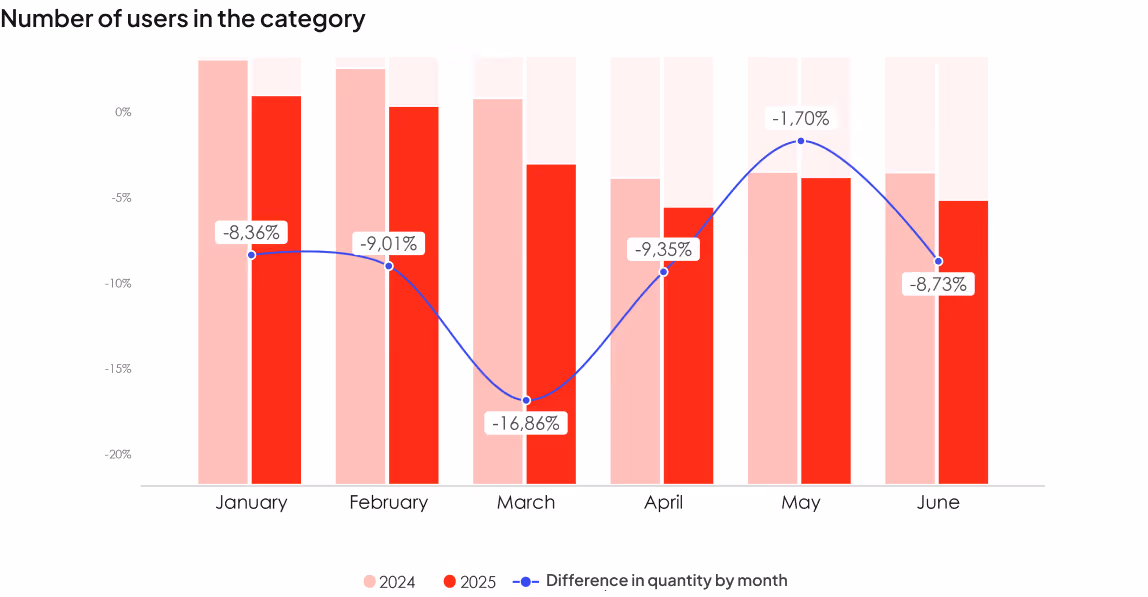
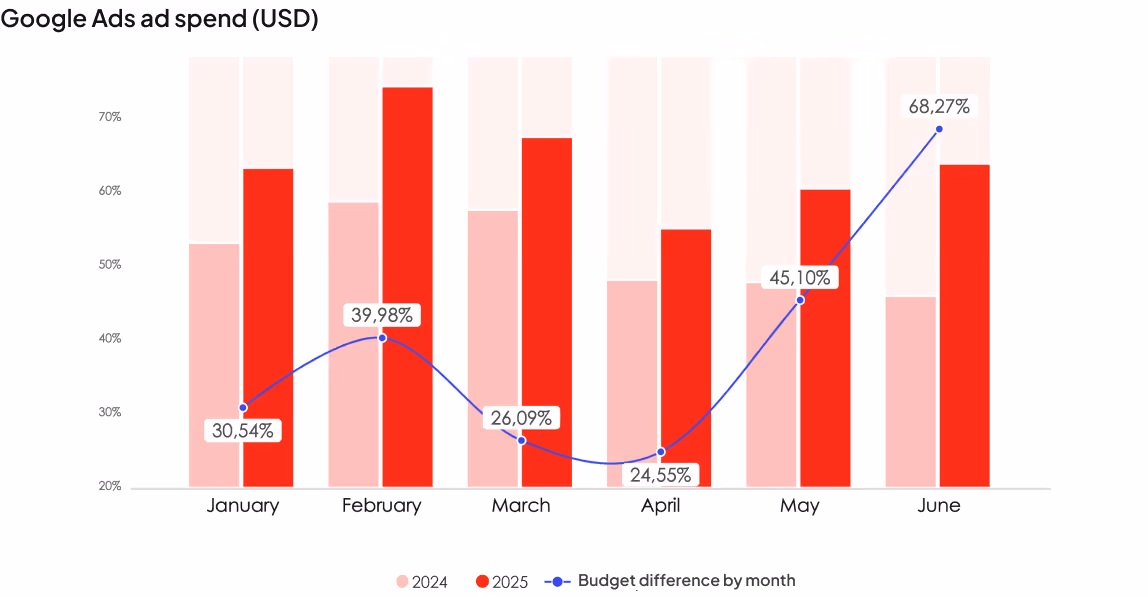
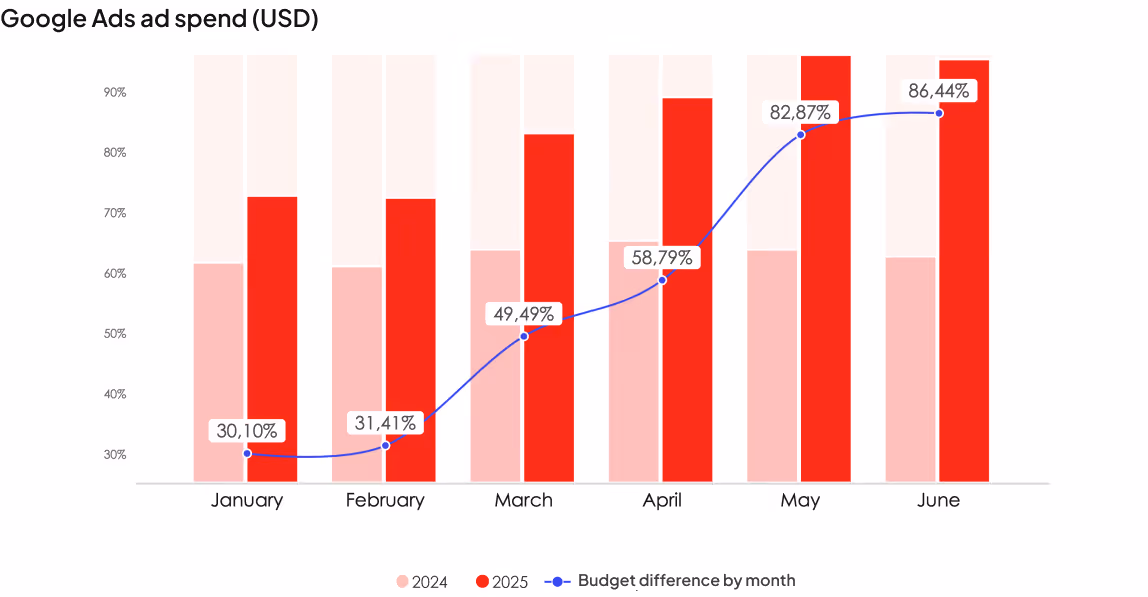
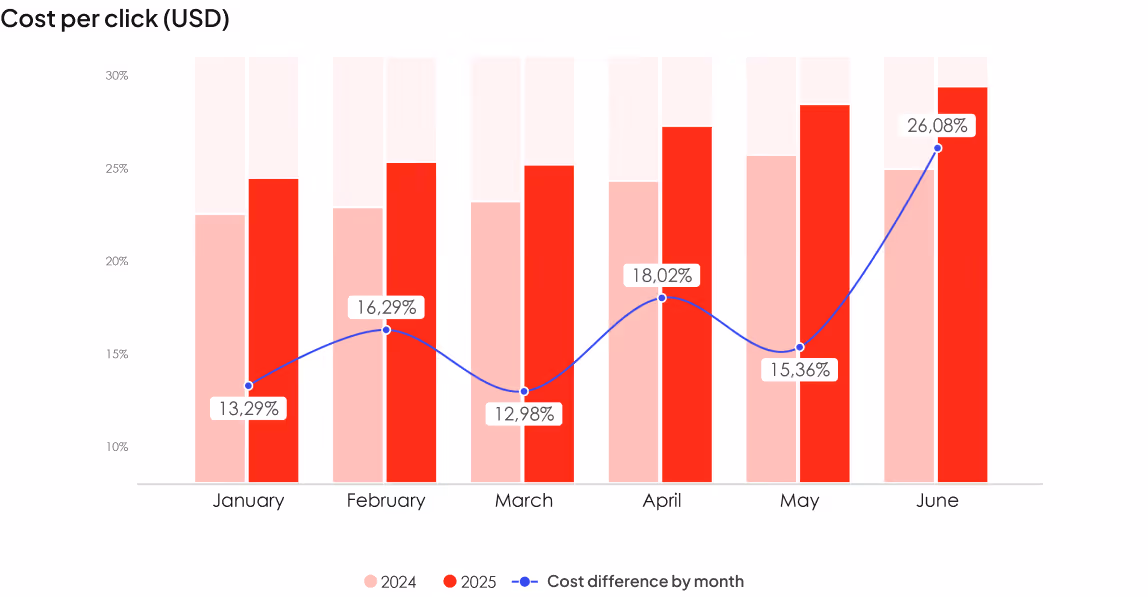
There is also a positive trend in traffic — it steadily increased by 11% during the first half of 2025. At the same time, the cost per click remained unchanged.
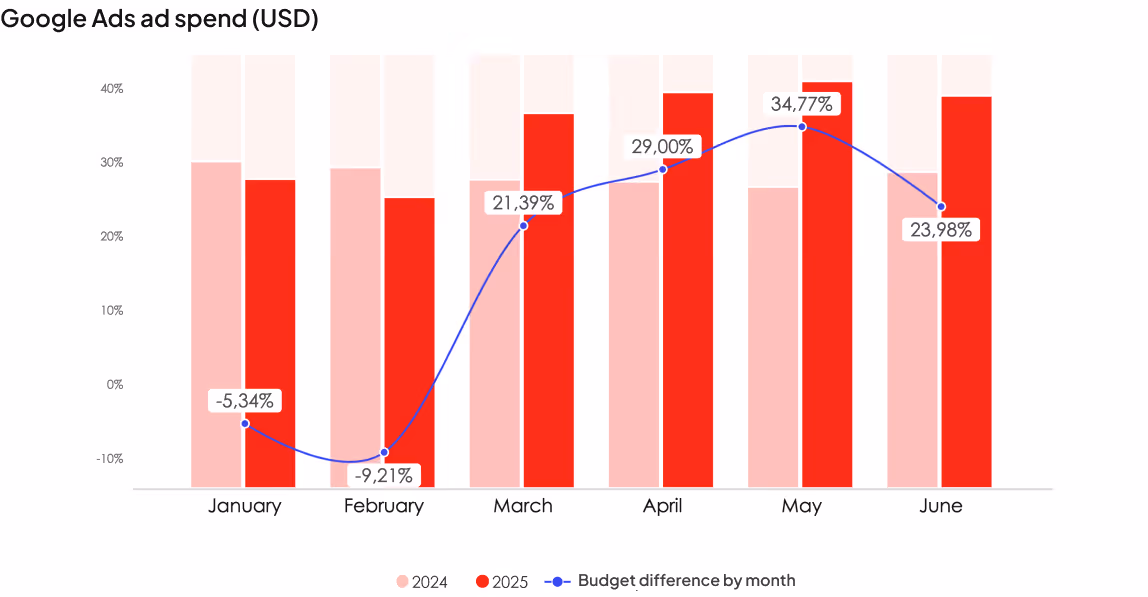
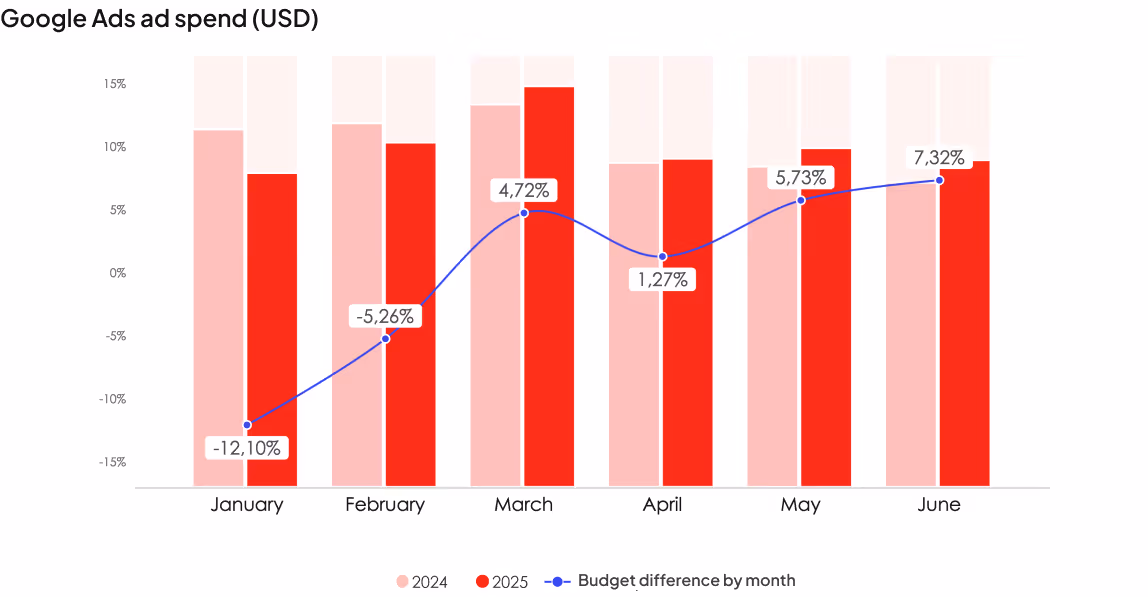
We observe that most players in this category saw a significant increase in ad-generated revenue. Other channels showed slight declines. Our hypothesis: when searching for electronics, Ukrainians tend to click on ads more often than on organic search results, for example. Overall, the effectiveness of paid channels has improved across all categories.
[[SLIDER-START]]
[[SLIDER-END]]
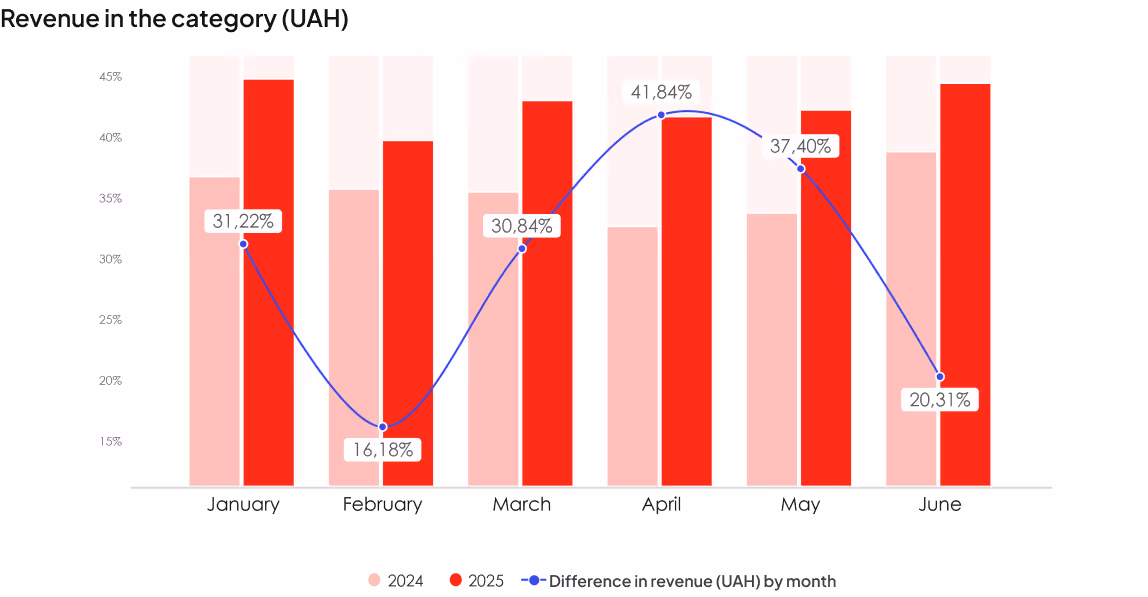
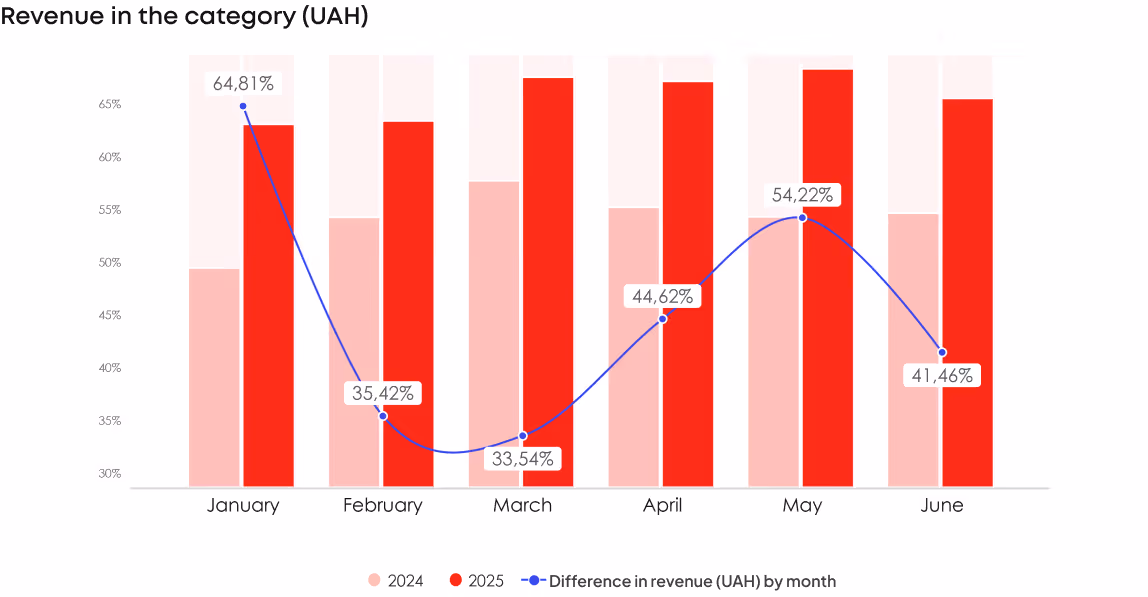
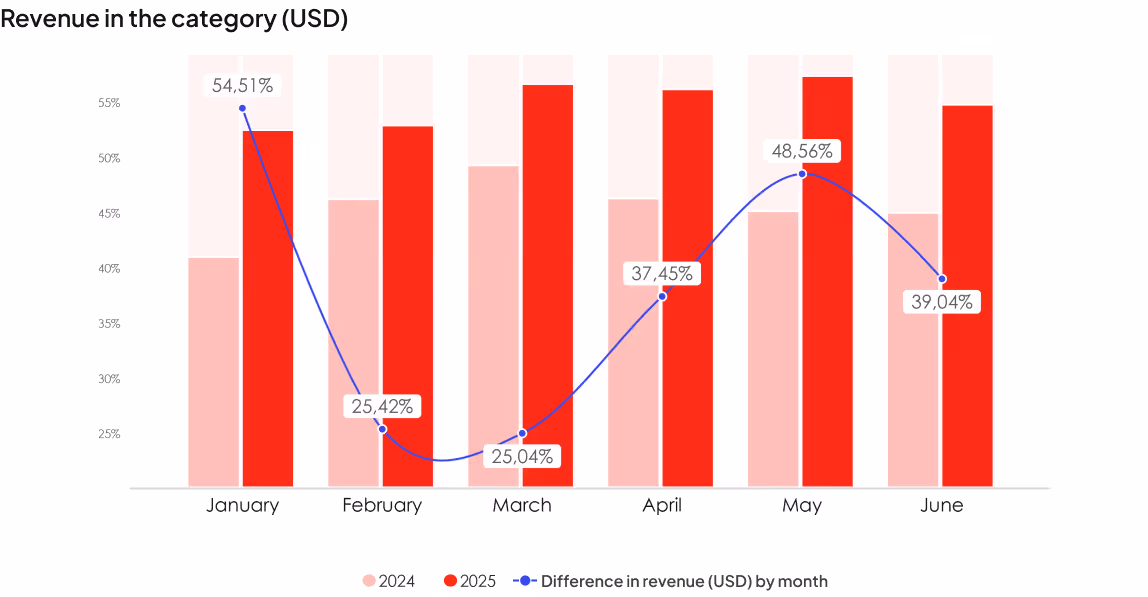
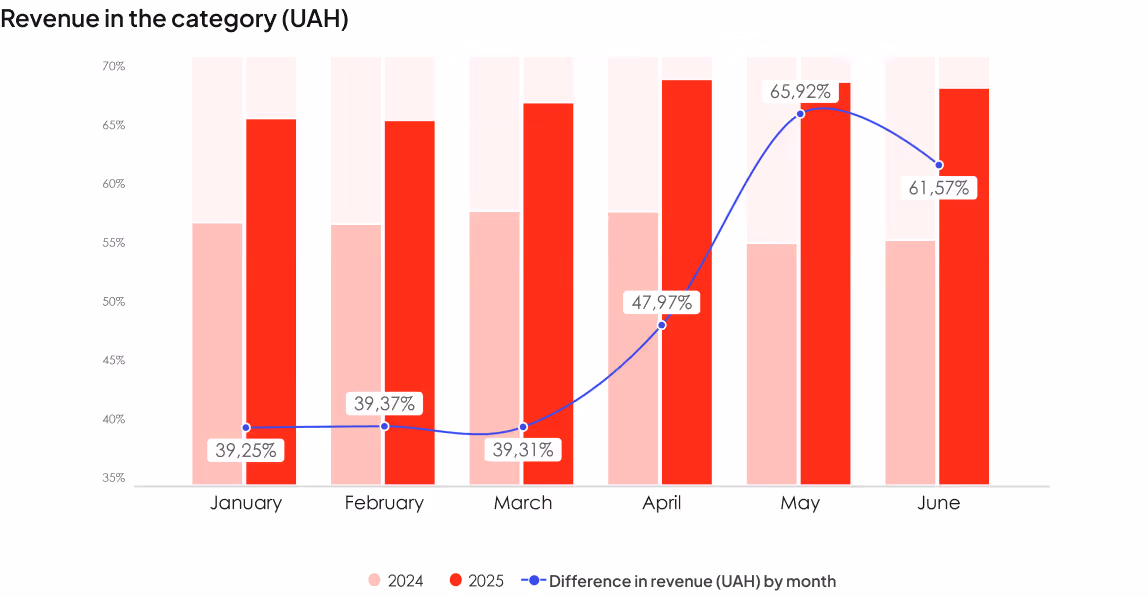
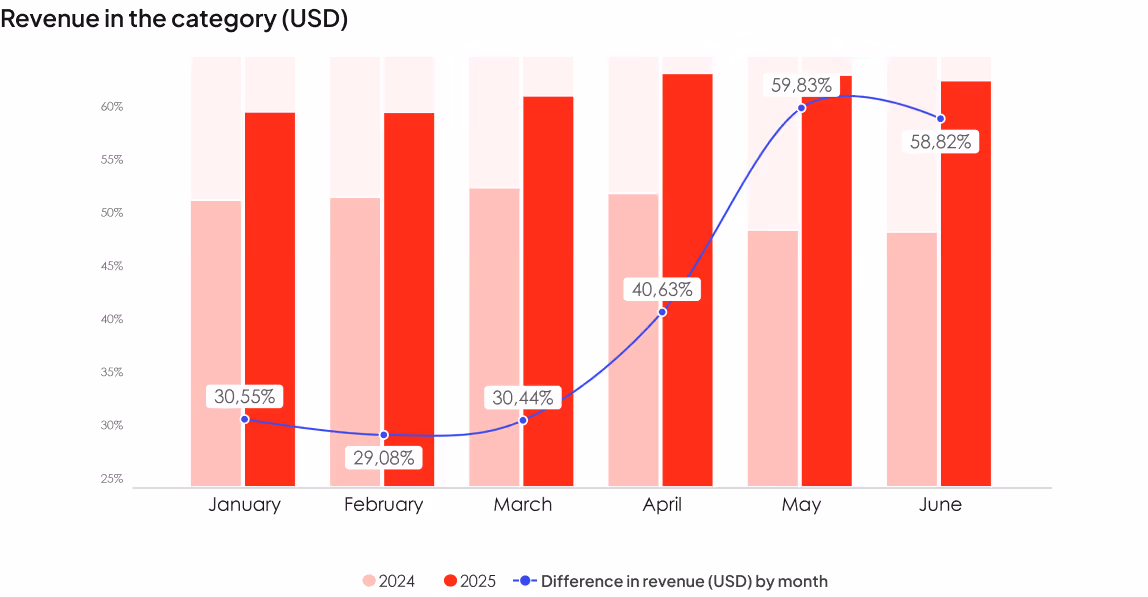
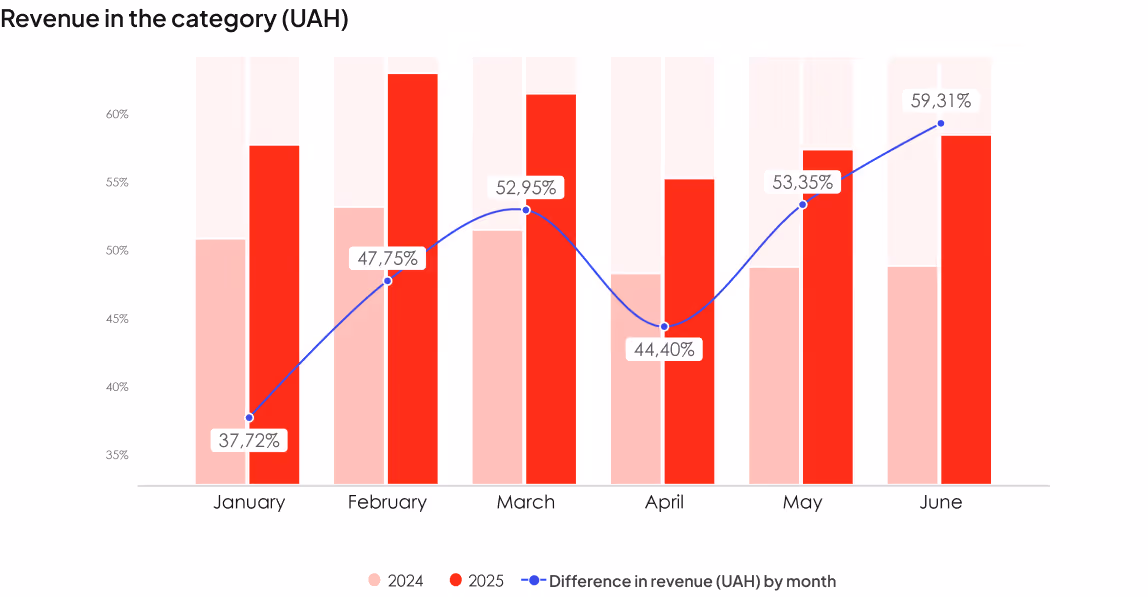
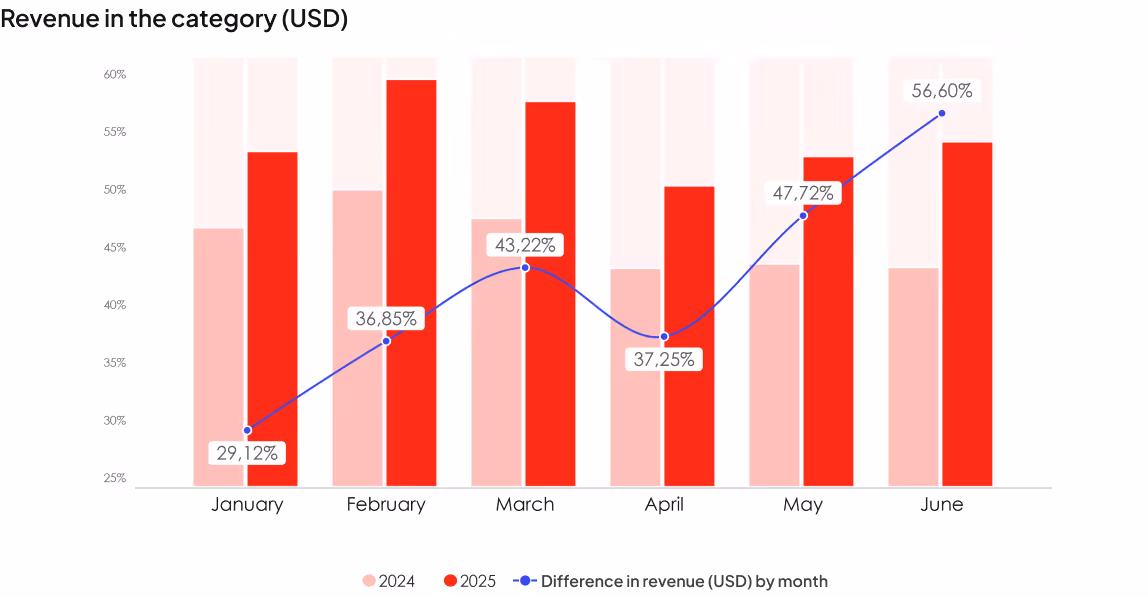
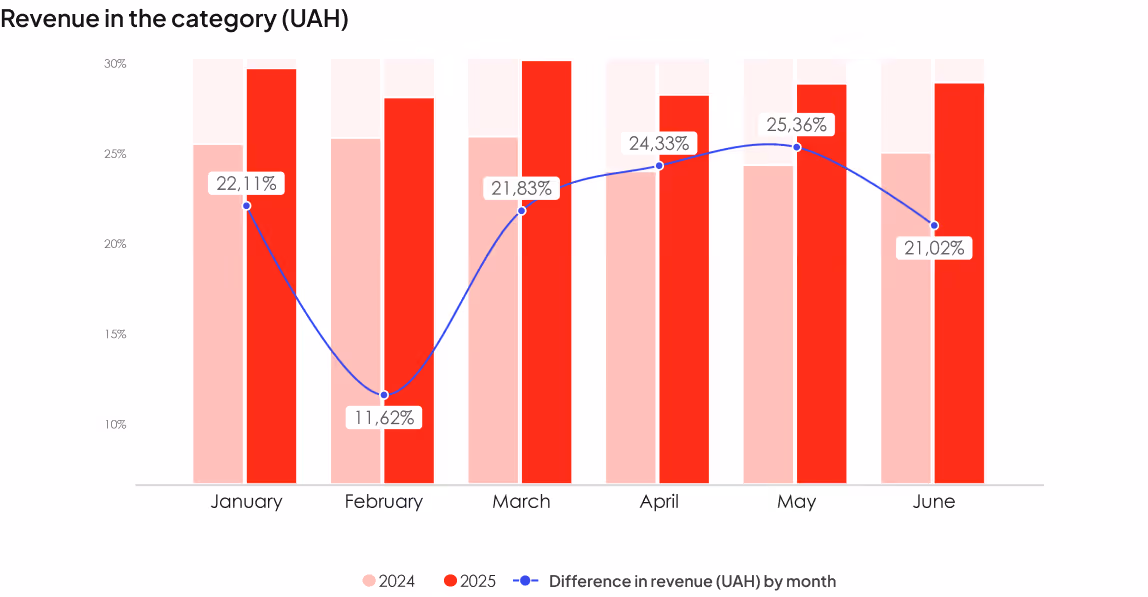
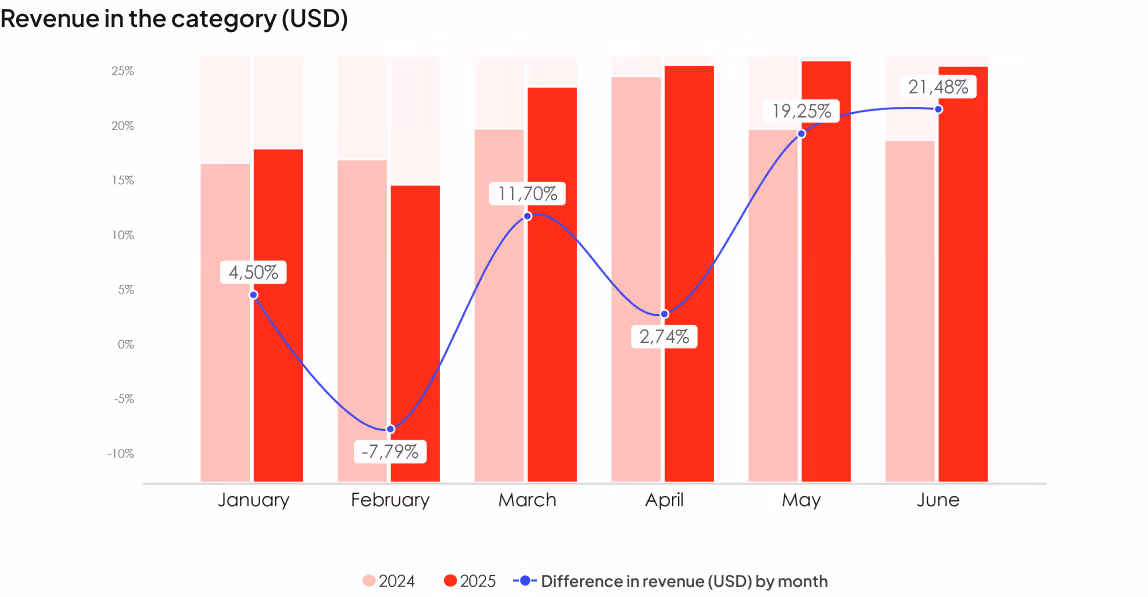
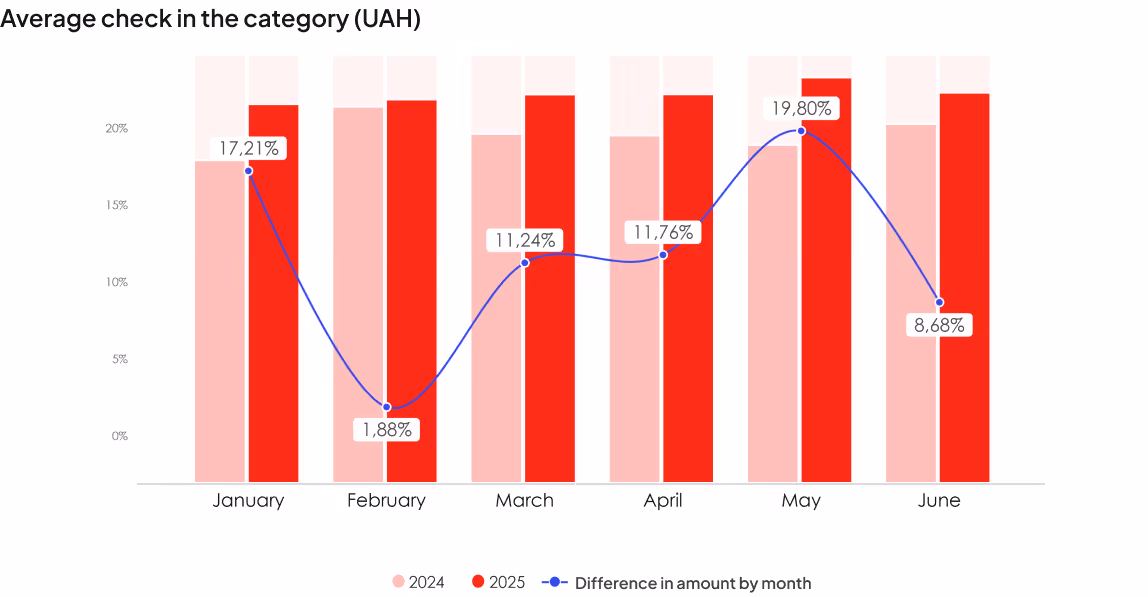
As we predicted, online penetration in this food and beverages industry continues to grow — the number of purchases in the first half of 2025 increased by 36%, and traffic grew by 25%. Compared to the first half of 2024, revenue in the category rose by 45% in UAH and 37% in USD.
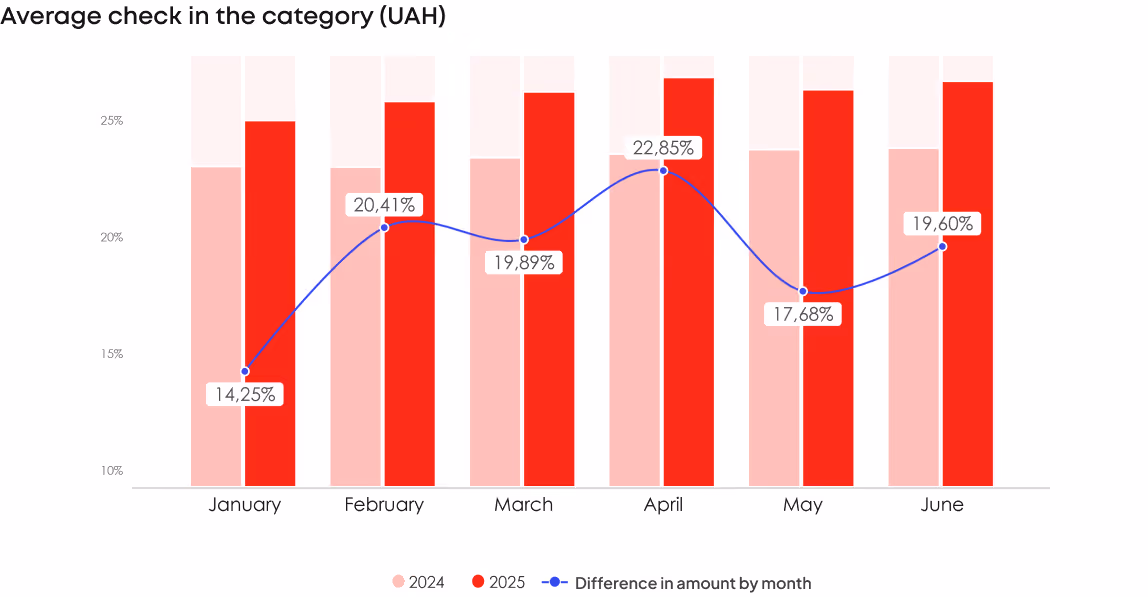
The average check increased by just 6% in UAH and 1% in USD. Most likely, users are making purchases more frequently but with smaller order values. The conversion rate also increased by 10%. Thus, the rising cost of goods in this niche did not significantly impact the growth of the average check.
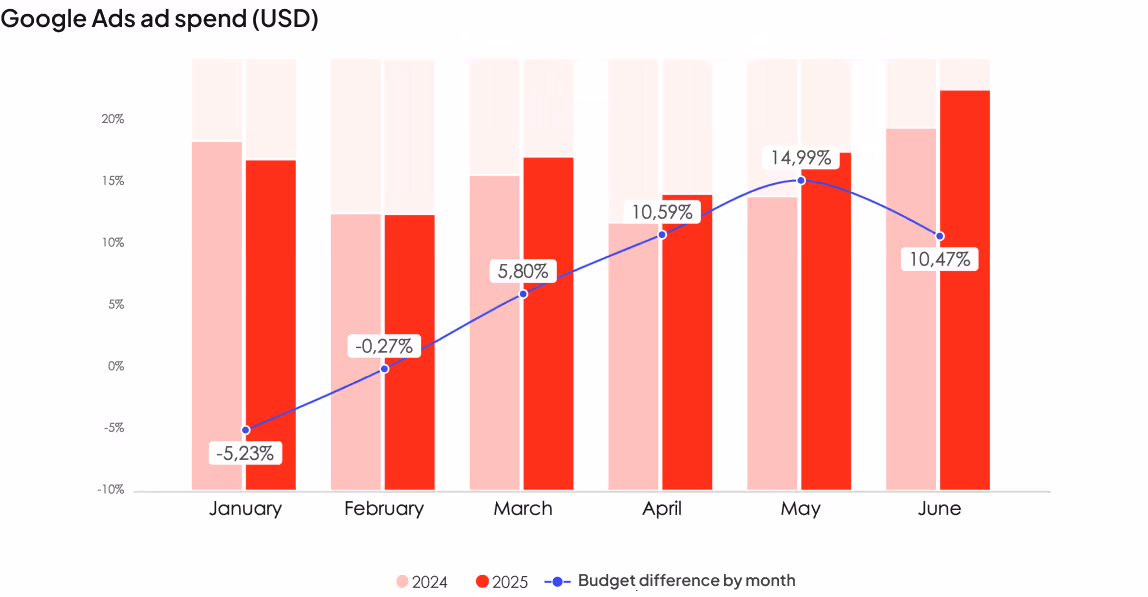
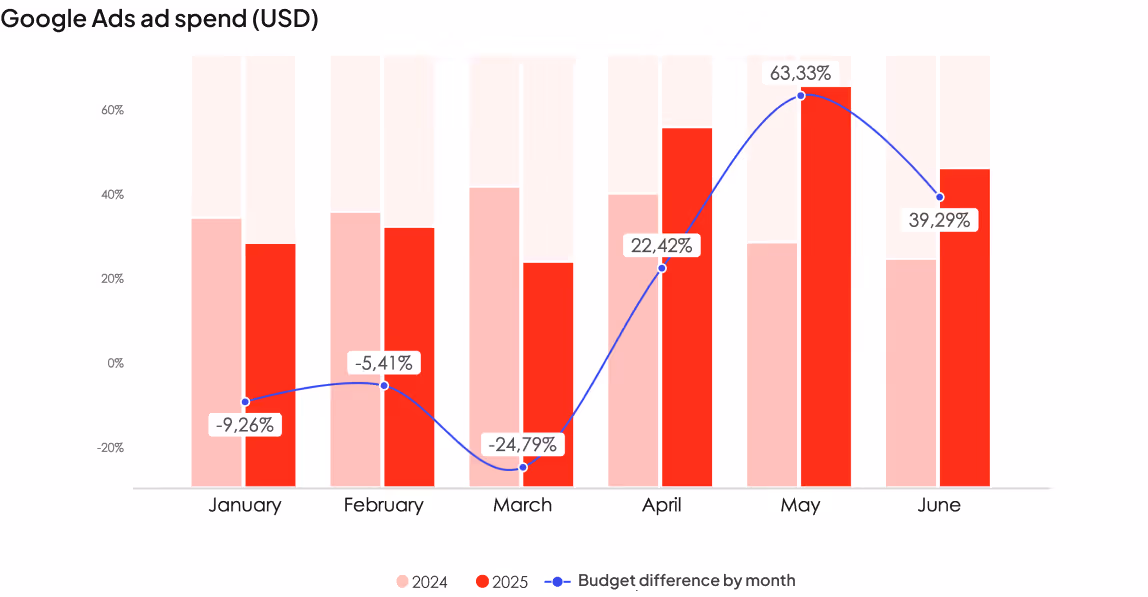
Businesses moderately increased their budgets in the first half of 2025, with an average growth of just 6% in USD. This means that the increase in traffic and number of purchases was not driven by advertising spend. The main reasons were a partial shift of the audience from offline to online and high demand for delivery services.
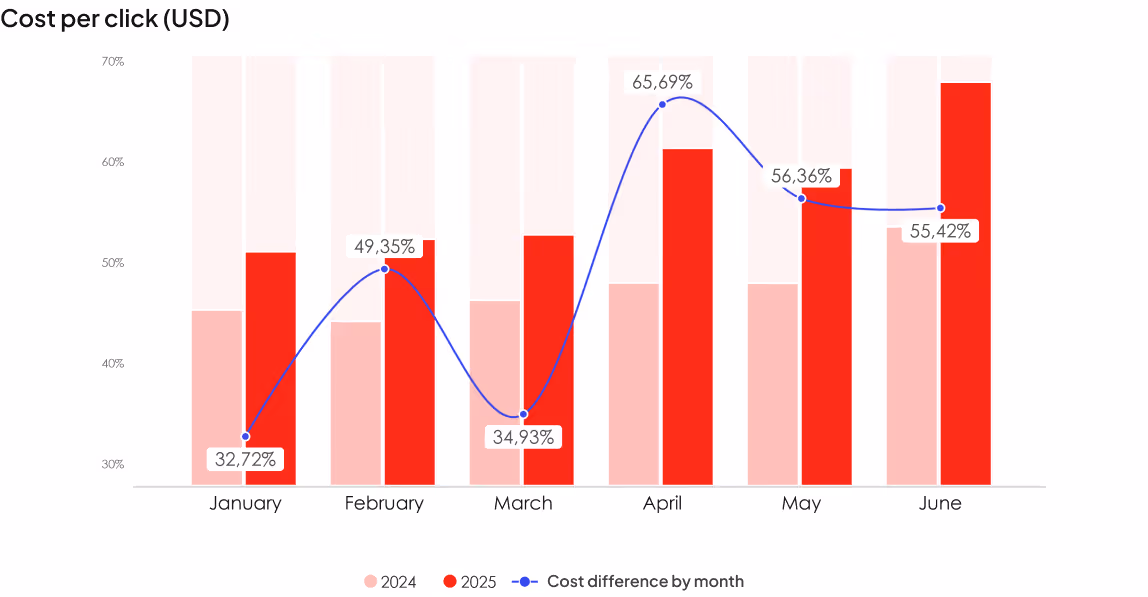
This category was the only one in our analysis where the cost per click in USD decreased — by 7%. It was only in June that the CPC was higher than in 2024.
[[SLIDER-START]]
[[SLIDER-END]]
If in the second half of 2024 we observed that the niche was on a certain profitability plateau, the beginning of 2025 showed growth of 48% in UAH and 40% in USD compared to the first half of 2024. Part of the revenue growth is associated with an increase in the average check and the number of purchases.
The number of purchases grew by 34%, while the average check increased by 19% in UAH and 13% in USD. We link this increase to rising costs rather than users buying more items or more expensive products.
The conversion rate increased by 50%. At the same time, traffic decreased by 9%. This means that current customers are purchasing more frequently.
Advertising budgets grew by 15% in USD compared to the first half of 2024. Most category players began to ramp up auction activity starting from early March. Meanwhile, the cost per click rose by 13% in USD. The auction became even more overheated.
[[SLIDER-START]]
[[SLIDER-END]]
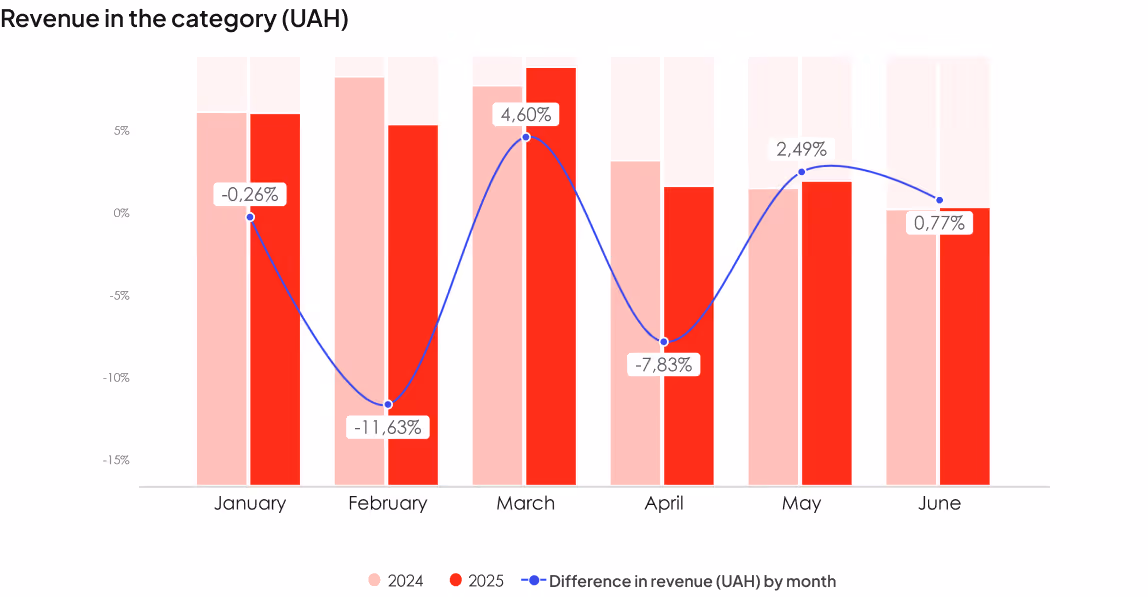
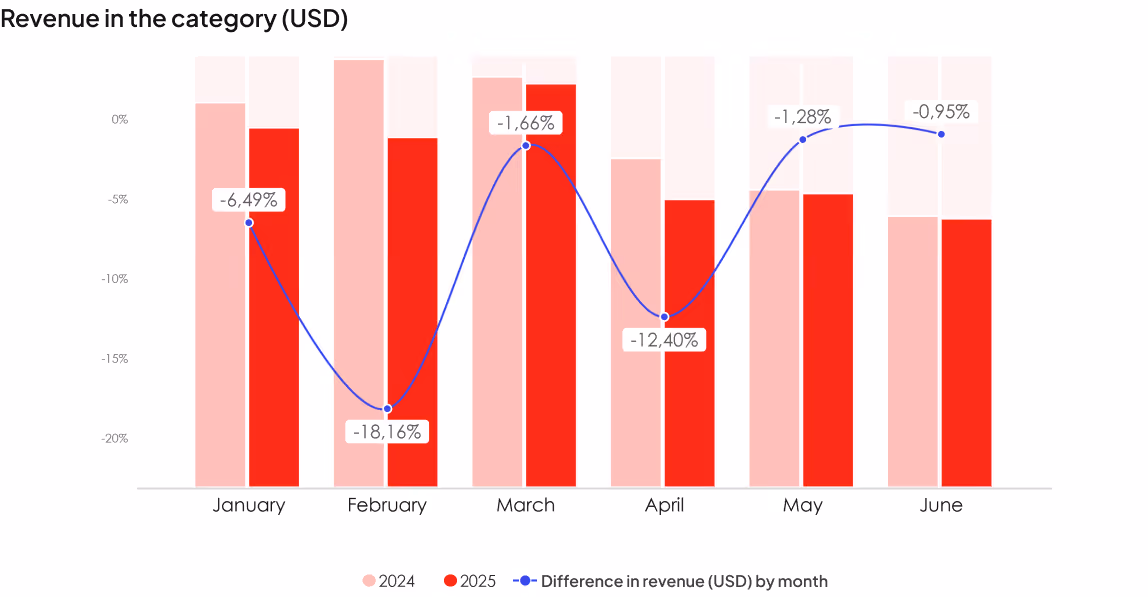
Revenue in this fashion and apparel industry declined by 2% in UAH and 7% in USD. The largest drop occurred in February — an 18% decrease in USD. The number of purchases also fell by 12%, and traffic decreased by 2%.
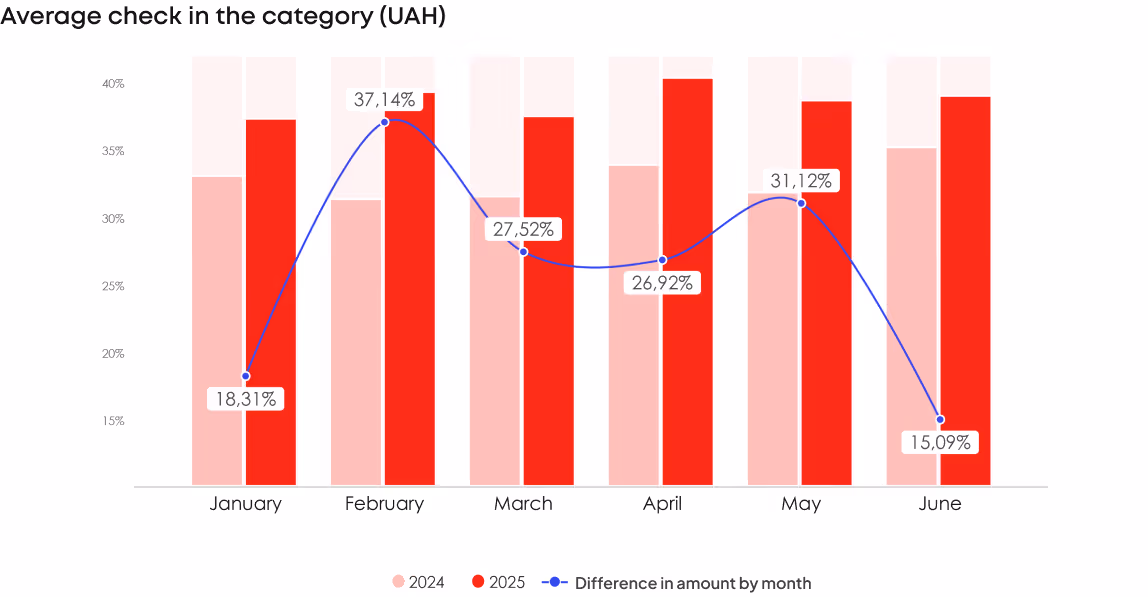
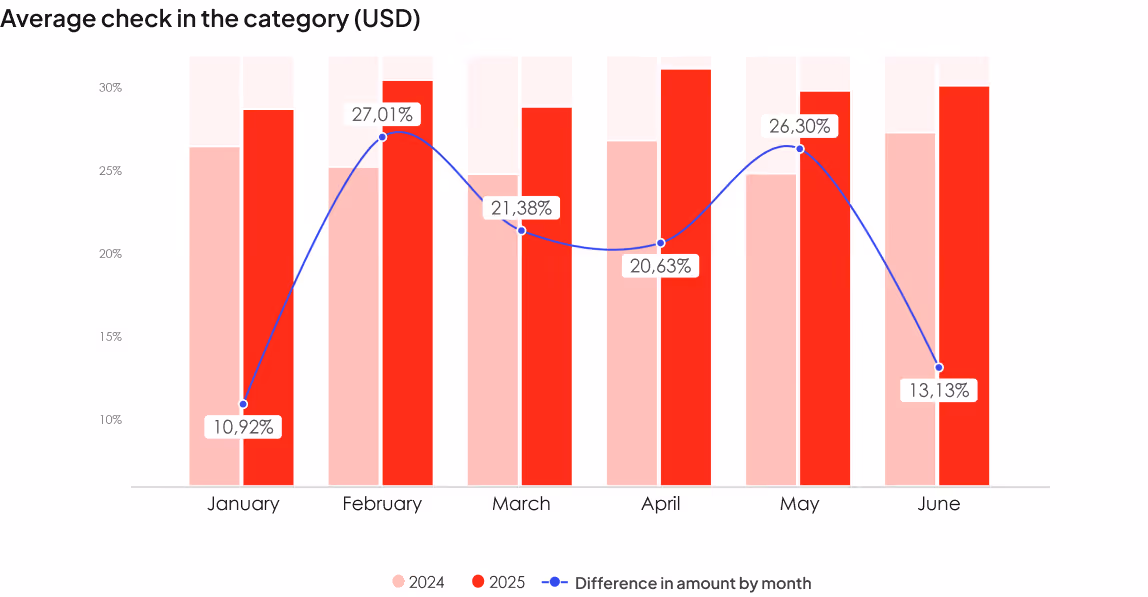
However, the average check increased by 20% in USD and 26% in UAH. At the same time, the conversion rate dropped by 10%. This means that the niche does not experience a sharp decline in profitability due to the rise in the average check.
Interestingly, there was no increase in advertising budgets in USD. Meanwhile, the cost per click in USD rose by 25%. Over 25% of the auction is bought by Temu alone, alongside many local players entering the market.
Despite the overheated auction, category players are following a strategy of attracting more expensive traffic that will generate sales.
[[SLIDER-START]]
[[SLIDER-END]]
We emphasize once again that the pharmaceutical and healthcare industries have become a fully developed eCommerce categories with a large share of online purchases in Ukraine. In 2025, compared to the first half of 2024, category players earned 23% more revenue in UAH and 17% more in USD. This sharp growth is linked to an increase in the average check by 41% in UAH and 34% in USD. The reason — new advertising restrictions and a shift in focus to other product groups for promotion.
At the same time, the number of purchases in the niche grew by only 13%, while the conversion rate declined by 4%.
Compared to the same period last year, traffic in the niche increased by 18%, but since May it has shown a downward trend despite the growth in advertising budgets.
Advertising budgets increased by 12% in USD, with the biggest rise occurring in April 2025. Meanwhile, the cost per click in USD rose by 53%. You may compare this numbers with healthcare digital marketing benchmarks. Our hypothesis: after the new legislation came into effect, players in this category significantly reduced their media budgets and redirected part of the funds to performance campaigns, which strongly heated up the auction.
[[SLIDER-START]]
[[SLIDER-END]]
The profitability of the niche continues to show an upward trend. In the first half of 2025, compared to the same period in 2024, growth amounted to 49% in UAH and 41% in USD. There is a slight dip in revenue before the summer season, but this is seasonal dynamics.
At the same time, the number of purchases increased by a small margin — only 18%, while the average check rose by 25% in UAH and 18% in USD. Thus, the growth in the average check was the key driver behind the increase in the revenue of niche players.
The conversion rate increased by 30%, but traffic declined by 9%. In this category, it is the current audience that is purchasing more frequently.
Advertising budgets in the niche grew by 38% in USD compared to the same period in 2024. The cost per click increased by 31%. The auction is overheated — so even with larger advertising budgets, businesses are achieving almost the same volume of sales.
The category exhibits traditional seasonality: demand rises before holidays and the wedding season. In 2025, we see a sales increase in May, likely related to Mother’s Day. It is possible that May will become part of the seasonal cycle in the coming years, similar to February and March.
[[SLIDER-START]]
[[SLIDER-END]]
The automotive industry continues to gradually grow in revenue. In the first half of 2025, this amounted to +15% in UAH and +9% in USD. At the same time, the number of purchases increased by only 1% during the first half of the year. The conversion rate rose by 5%, while the number of users decreased by 4%, which led to minimal growth in the number of purchases.
The average check increased by 12% in UAH and 6% in USD. It is this growth that directly influenced the increase in revenue in this category.
Category players continue to steadily increase their advertising budgets to maintain revenue growth and boost brand awareness.
In the first half of 2025, the cost per click rose by 18% in USD, and this gradual increase is directly related to the growth of advertising budgets. Check out the global digital marketing benchmarks in automotive industry.
This is one of two categories in our analysis where players reallocated advertising budgets in the first half of 2025 in favor of PMax campaigns. It is also the only category where the growth of PMax campaigns was so significant — 12%.
[[SLIDER-START]]
[[SLIDER-END]]
As we predicted, in 2025 Ukrainian business is operating in a declining market: the population is decreasing, and the hryvnia continues to gradually weaken. Users are becoming even more price-sensitive, actively seeking bargains, promotions, and discounts. They buy more often but with smaller checks or choose cheaper products.
Currently, it is primarily existing customers who provide a more stable and predictable revenue stream across almost all niches. On average, the cost per click has increased by 4% in USD across all niches, though in some categories the growth is significantly higher.
The buyer audience is shrinking and is not expected to grow this year or next, unless there is a shift from offline to online. The share and cost of advertising will continue to rise, so the focus must be on customer retention strategies that include deepening relationships and loyalty programs with personalized offers.
The effectiveness of paid advertising is increasing for all categories since other channels show lower engagement rates.
An important emotional trigger for purchases now are festive moments: birthdays, Christmas, and other family events. Gamification helps increase profitability before such dates.
The share of mobile traffic is growing; last year, 60% of online purchases were made via phone. Among major retailers, every fourth order came through a mobile app.
We also see a 450% increase in traffic from AI agents in the first half of 2025. However, this still accounts for only 0.1% of total traffic. Therefore, investments in SEO (GEO) and PR remain critically important.

PR & Marketing Manager at Promodo
I am a former journalist and an ardent follower of the "Cut to the chase" principle.
Together with Promodo's marketing team, I tell about the most interesting things in the world of Ukrainian digital. No stories of successful success – only tips, figures, and working case studies from the leading performance marketing agency. By the way, I talk about our failures as well.
You may also like
Choose quality and trusted services to improve the presence of your company on the Internet, and feel free to contact our UK team if you have any questions.

Furniture marketing is peculiar for certain reasons. First is that for customers buying furniture this is often emotional and exciting.

Unlike cold calls that often get ignored by their recipients, PPC puts your offer directly in front of motivated sellers actively looking for help.

How to enter a new market? This is the question lots of retailers who successfully promoted their products within certain regions frequently ask.
We at Promodo are ready to help you improve your performance across all digital marketing channels.
Get started