Content


Copywriter at Promodo
Over nearly three years as a copywriter, I’ve written for US and European startups and companies, including SE Ranking. I enjoy working with words—finding the right phrasing, organizing ideas, and turning them into clear and useful content that shows real value and helps businesses grow.

Mobile App Marketing Specialist

In this article, you’ll find up-to-date mobile marketing benchmarks for retention, engagement, conversion, etc, and professional insights on what they mean.
According to the Adjust report, in 2025, the average global eCommerce app session length declined from 10.04 to 9.6 minutes. In the Asia-Pacific region, it declined from 9.42 to 9.14; in Europe, from 10.87 to 10.53; and in the Middle East and North Africa, from 9.56 to 8.61. North and Latin America still remained the same (8.69 and 8.58 minutes).
On global eCommerce day 0, sessions per user decreased from 1.37 to 1.36 in 2025. There were declines across all the regions mentioned above, except Latin America (increased slightly from 1.35 to 1.36).
Average session length (minutes) in 2025:
In practice, shorter session lengths in eCommerce may indicate that users are acting more intentionally and making purchases faster. That’s why this metric should only be evaluated alongside conversion, retention, and ROI.
If overall funnel efficiency is improving, it’s a positive signal. If conversion and profitability are declining simultaneously, it’s worth investigating potential issues such as user attention loss, a complex user journey, or weak retention.
- Viktoriia Loshak, mobile app marketing specialist.
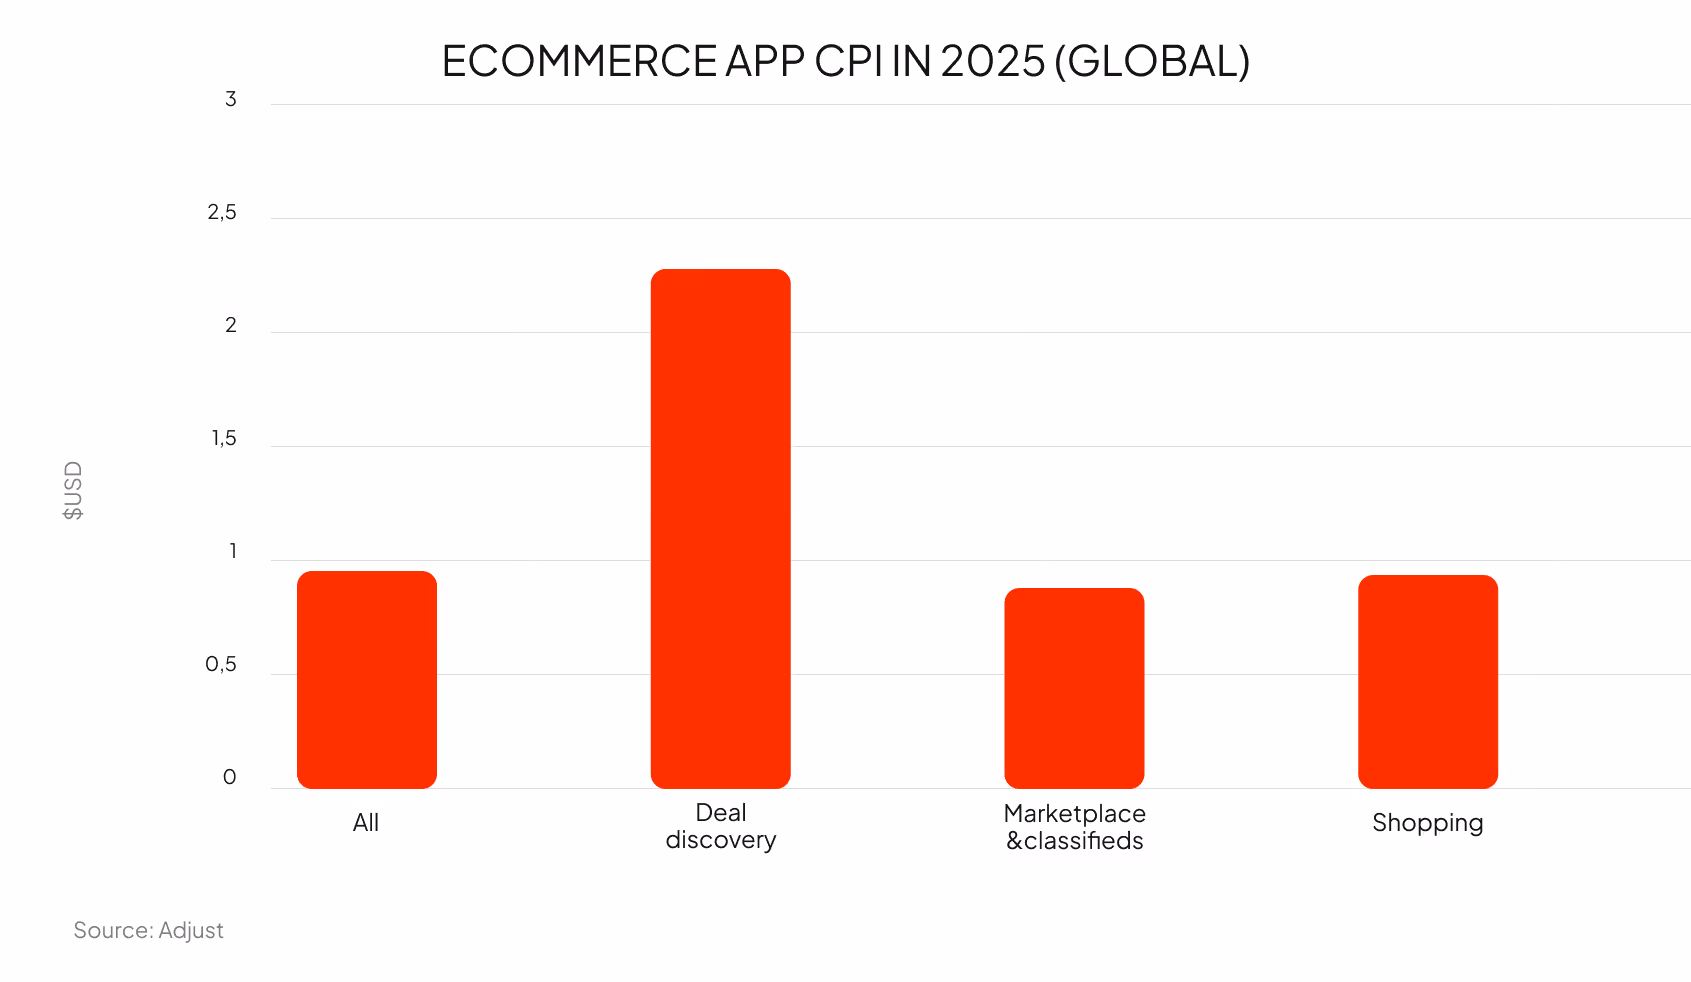
According to Adjust, the average cost per install (CPI) for global eCommerce apps decreased slightly in 2025, from $1 to $0.98. At the same time, trends varied by subcategory. Deal discovery apps became more expensive to acquire users for, with CPI rising from $1.44 to $2.26. In contrast, marketplace and classifieds apps saw costs fall from $0.99 to $0.88, while shopping apps experienced a smaller decrease from $0.93 to $0.91.
CPI levels in 2025 varied significantly by region. The Asia-Pacific region had the lowest cost at $0.68, followed by the Middle East and North Africa at $0.51. Europe was notably higher at $2.25, while North America remained the most expensive region with a CPI of $2.49.
Based on our experience, a lower CPI alone doesn’t necessarily indicate better performance. If install costs go down but Day 30 retention or purchase conversion rates don’t hold, it usually means you’re attracting cheaper but lower-quality users.
That’s why CPI needs to be considered alongside post-install user quality—retention, purchase conversion, and overall payback.
- Viktoriia Loshak, mobile app marketing specialist.
In 2025, the paid-to-organic ratio reached 0.54 for eCommerce apps and 0.57 for shopping apps, confirming that paid acquisition is now the primary source of installs.
An increase in the paid/organic ratio in eCommerce is a clear signal that organic demand is no longer enough to sustain growth. Businesses are relying more on paid channels to maintain install volume.
At the same time, this means a growing dependence on paid traffic, which puts more pressure on the efficiency of the UA strategy and the quality of the users acquired in the long run.
Viktoriia Loshak, mobile app marketing specialist.
According to the report, finance apps shifted further toward paid acquisition in 2025.
Paid-to-organic ratio by region (Adjust):
In 2025, global eCommerce app installs dropped by 10%, while sessions still grew by 5%, showing stronger engagement despite slower growth. Performance followed a clear seasonal pattern: in February, installs were 8% below average and sessions 11% below.
In Q4, both started to recover. Installs increased by +6% in November and +4% in December, while sessions increased by +10% in November and +5% in December (Adjust).
The clear recovery in installs and sessions in Q4 confirms that year-end peaks remain a key growth driver for eCommerce, and results in Q1–Q3 should be evaluated with this in mind.
- Viktoriia Loshak, mobile app marketing specialist.
By subcategory, deal discovery apps saw installs increase by 2% and sessions by 6%. Marketplace and classifieds apps grew sessions by 4%, while shopping apps saw a 7% increase.
User stickiness depends a lot on the app type. Social media apps will definitely have a higher percentage, since we all use them a lot. But for shopping apps, for example, the ratio is much lower, because people buy things only from time to time.
And the numbers prove that.
Source: Kissmetrics
Source: KPI Tree
According to Adjust’s report, retention rates for eCommerce apps declined slightly in 2025. Day 1 retention dropped from 13.2% to 12.6%, and Day 7 decreased from 6.3% to 6%. Day 14 remained relatively stable at around 4.4%, and Day 30 retention stayed unchanged at 3%.
In 2025, retention varied by subcategory. Marketplace and classifieds apps saw a slight drop in early retention, while shopping apps stayed mostly stable, with only a small decrease on Day 1.
Finance app retention rate benchmarks for finance apps according to Adjust:
Retention and engagement benchmarks according to Digital Applied:
Mobile app retention benchmarks by app category:
Source: Getstream
Mobile app conversion benchmarks:
Source: UXCam
App Store Conversion Rate Benchmarks (according to UXCam):
A solid LTV-to-CAC ratio starts around 3:1. In eCommerce, it often rises to 4:1, but this depends on margins and pricing.
If the ratio drops closer to 2:1, it usually means most of the revenue is spent just to cover acquisition costs, and there’s very little room for other costs or profit.
At the same time, an extremely high ratio like 10:1 can indicate that you’re underinvesting and missing opportunities to grow faster.
Here are the reference points across three platforms on what typical ROAS can look like in 2026:
Source: Segwise
According to Digital Applied, push notification performance varies significantly depending on how messages are targeted. Personalized notifications outperform generic sends, and richer formats also drive higher engagement.
Apart from CTR, other push-related metrics provide additional context on performance and user behavior:
Conversion rates vary widely by platform, with iOS clearly ahead (SplitMetrics).
iOS traffic tends to convert more easily, while Android traffic often requires more effort to achieve the same result.
As for engagement rate, iOS numbers are again higher than Android (SplitMetrics).
Still, users scroll quickly and make fast decisions, so your store page needs to be optimized and attention-grabbing in any case.
Source: SplitMetrics
Most installs happen on the first view—23% on iOS and 12% on Android, and only a small share of users explore and convert. This means most users decide right away whether to install, without exploring the full page.
In practice, this shifts the focus to top-of-page assets: icon, title, rating, and first screenshots.
According to the SplitMetrics report, bounce rates differ significantly by platform; iOS shows a higher drop-off.
We recommend regularly monitoring ratings and reviews. This helps build user trust, improve install conversion, and drive more organic traffic.
Based on Promodo data, a rating of 4.2 or higher is considered good. A rating of 4.5 or higher has the strongest impact on trust and can increase install conversion by 10–20%.
- Viktoriia Loshak, mobile app marketing specialist.
Even though there are numbers to look at, that doesn’t mean they are a universal reference for every business. Here are a few tips from Promodo specialists:
Start with your own historical data. Ideally, you need at least 4–6 quarters to see stable patterns. Without that, there’s no real point of reference.
A longer time frame also helps you account for seasonality. For example, Q1 is typically more expensive and less efficient than Q4. That’s normal and shouldn’t be treated as a performance issue.
To read your data correctly, compare results both quarter-over-quarter (QoQ) and year-over-year (YoY). Looking at only one of these can give you a distorted picture.
Review benchmarks regularly—ideally, every quarter. The market evolves fast, and benchmarks from even a year or two ago often no longer reflect reality.
- Viktoriia Loshak, mobile app marketing specialist.
Want to understand your real benchmarks and improve results? Promodo can help you analyze performance and scale more effectively.

Copywriter at Promodo
Over nearly three years as a copywriter, I’ve written for US and European startups and companies, including SE Ranking. I enjoy working with words—finding the right phrasing, organizing ideas, and turning them into clear and useful content that shows real value and helps businesses grow.
Mobile App Marketing Specialist
You may also like
Choose quality and trusted services to improve the presence of your company on the Internet, and feel free to contact our UK team if you have any questions.

AIDA is a relevant marketing model leveraged by competitive businesses in various contexts.

Email marketing is a powerful tool for reaching the target audience and expanding the client base.

Have you ever felt like you're spinning in circles trying to get your insurance agency noticed? Trust me, you’re not alone.
We at Promodo are ready to help you improve your performance across all digital marketing channels.
Get started


.avif)