Content


Marketing Specialist at Promodo
I have been working in marketing since 2012 with an emphasis on market research and analytics. I am experienced in the following niches: food wholesale, insurance, real estate, and software distribution. I have been responsible for Promodo's cases since 2021. Doing marketing research, I focus on causes and effects, as well as measurable results.

In our new research on the Ukrainian eCommerce market, we compared performance dynamics across 7 niches using weighted-average metrics for each category. We compared the results of the second half of 2025 with the same period in 2024.
Since the start of the full-scale war in Ukraine in 2022, Promodo’s team has conducted this research twice a year to track how the market is evolving. Explore our previous reports to see how trends have shifted over time and compare the dynamics across different periods.

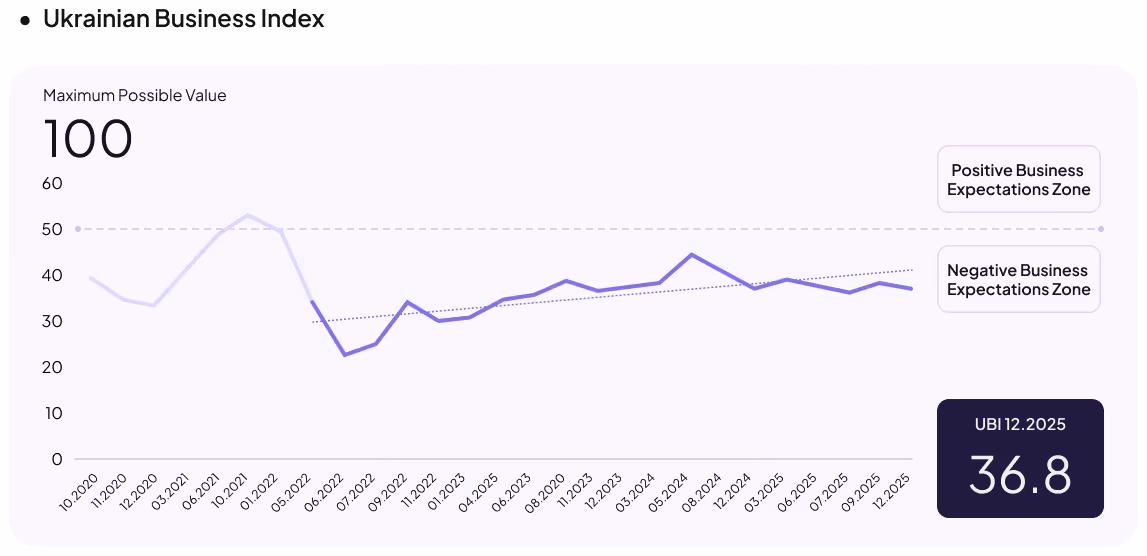
The second half of 2025 for Ukrainian eCommerce took place amid heightened uncertainty. Businesses largely maintained pessimistic expectations, driven by a shortage of qualified personnel, limited consumer purchasing power, and the country’s challenging energy and security situation.
Under these conditions, the Ukrainian Business Activity Index continues its downward trend: from 43.7 points in 2024 to 36.8 points in 2025 out of a possible 100. This indicator reflects a moderate deterioration in business expectations compared to the previous period.
The key difference between 2025 and 2024 is the decline in peak growth in December. While in 2024 the transaction volume in December increased by nearly 35%, in 2025 growth was limited to 12%.
At the same time, Ukrainians are spending increasingly more time online. 44% of users spend more than three hours a day on messaging apps, 36% spend the same amount of time on video platforms, and 30% on social media, while television remains important for only 17% of the audience. This shift is influencing consumer behavior and shaping new online habits.
In 2025, there is no decline in order volumes — on the contrary, online retail is actively seeking new solutions to encourage customers to choose online shopping over offline stores.
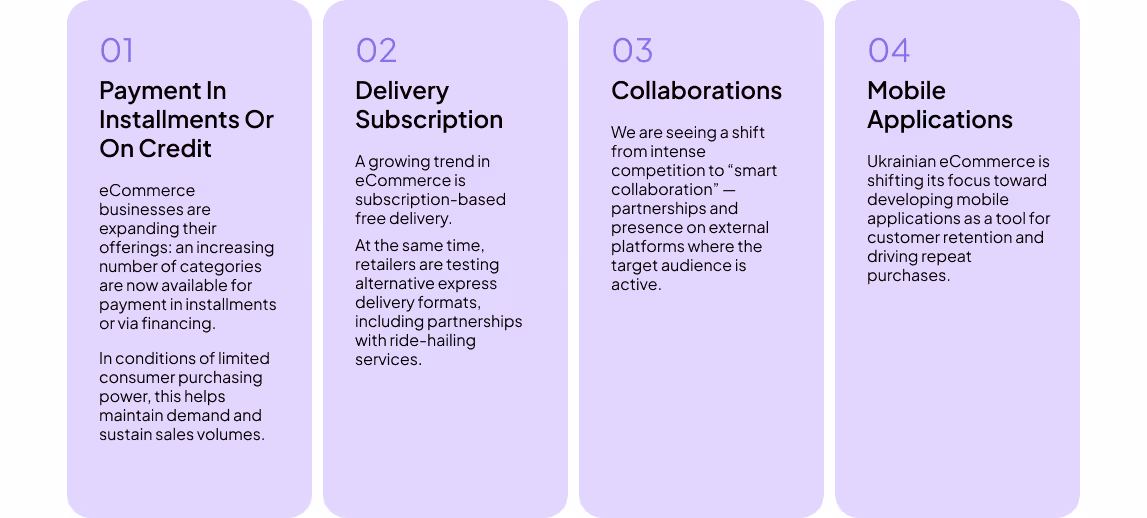
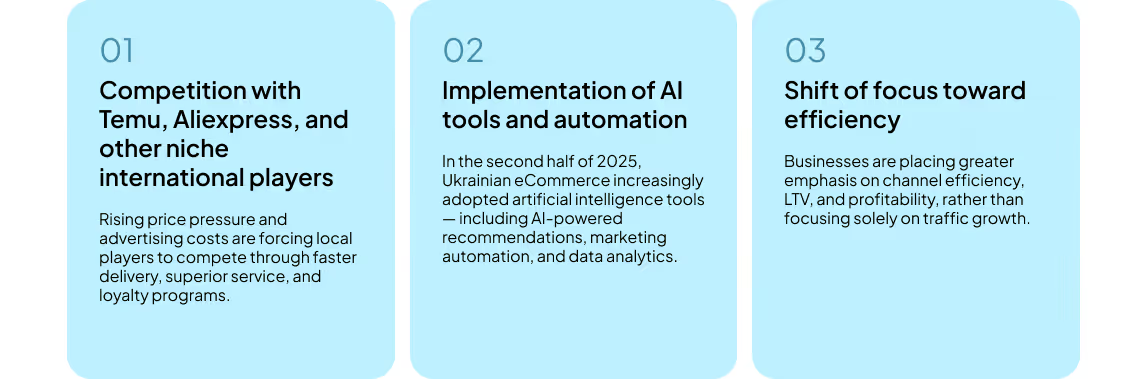
In the second half of 2025, some previously established trends remain relevant — particularly the focus on automation and customer retention. At the same time, aggressive traffic scaling is gradually losing priority due to rising advertising costs and shifts in consumer behavior.
Compare these insights with the global eCommerce trends.
The charts were visualized using weighted-average metrics for each category. The sample includes players with different turnover levels. The performance indicators for the second half of 2025 were compared with the same period in 2024.
[[SLIDER-START]]
[[SLIDER-END]]
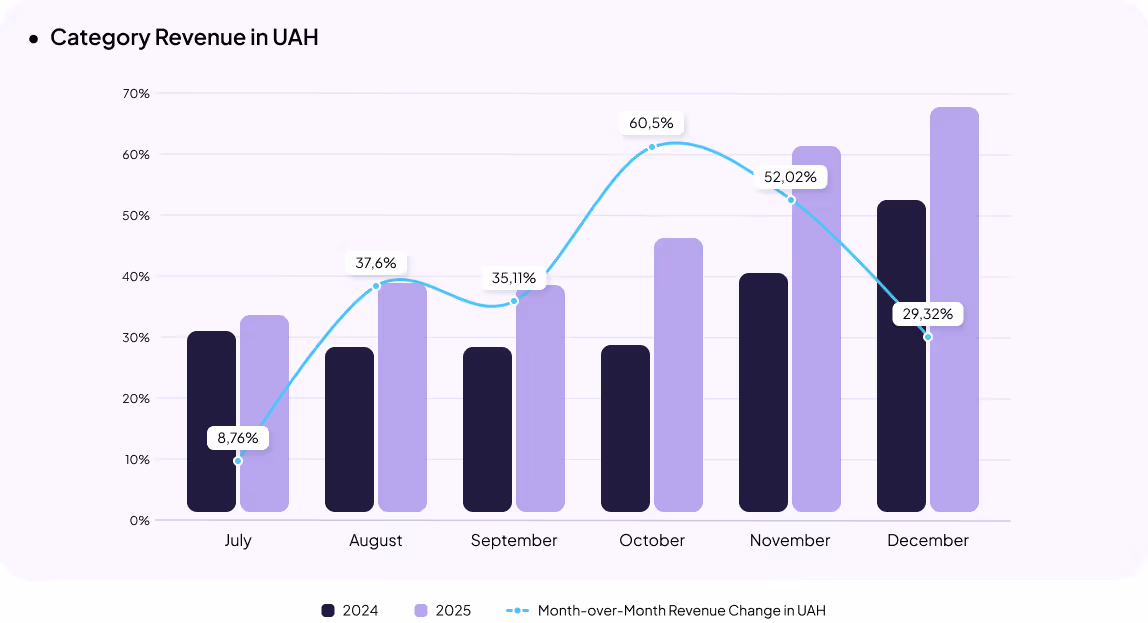
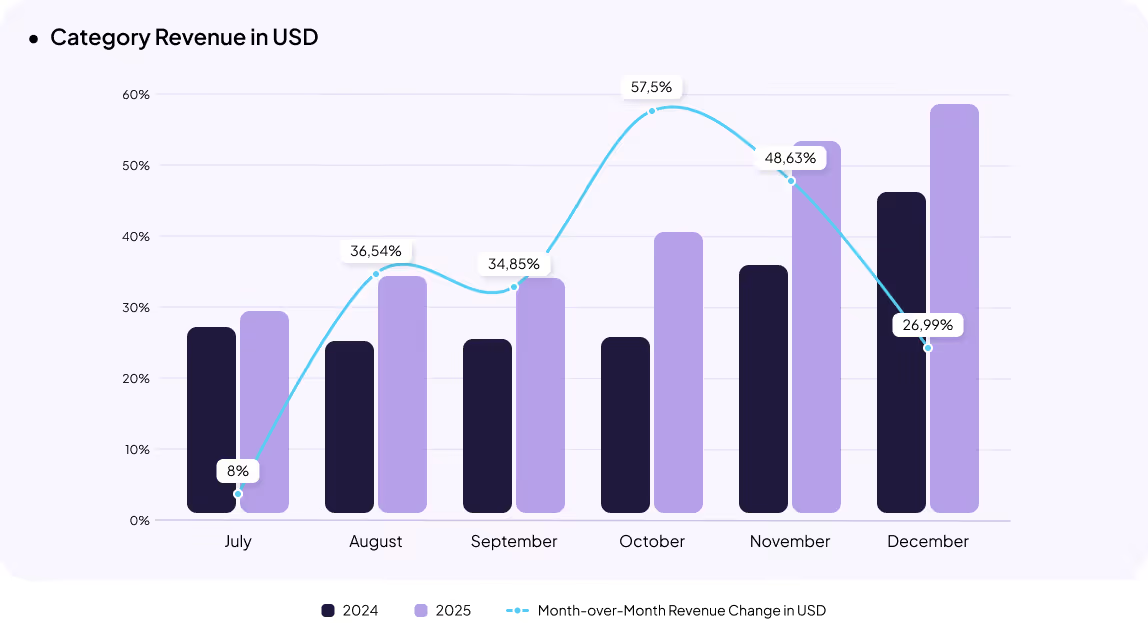
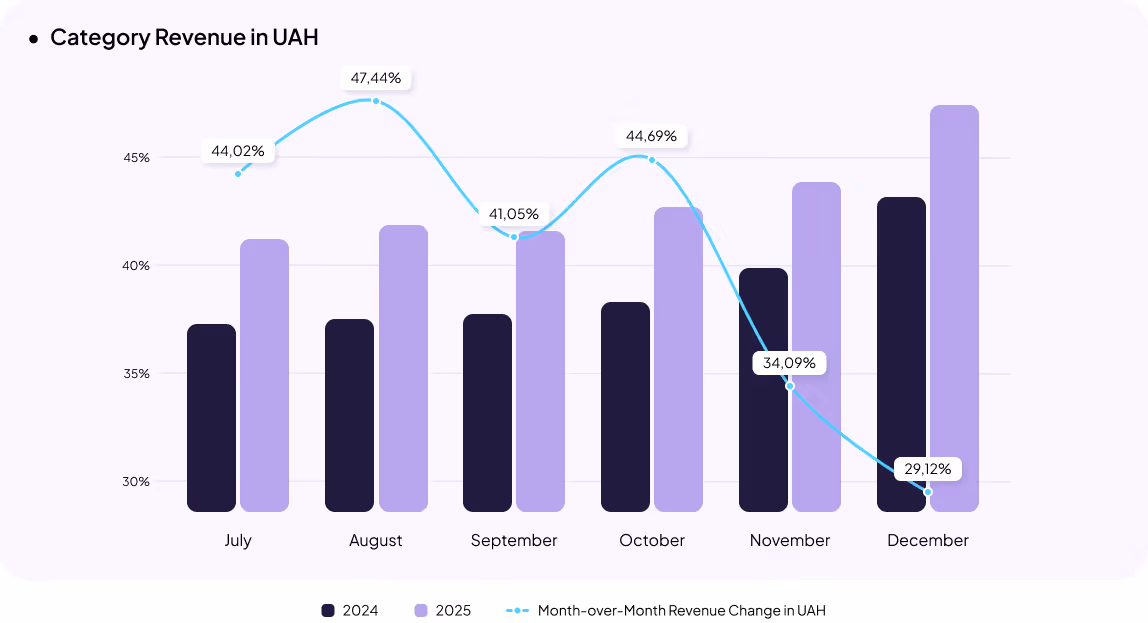
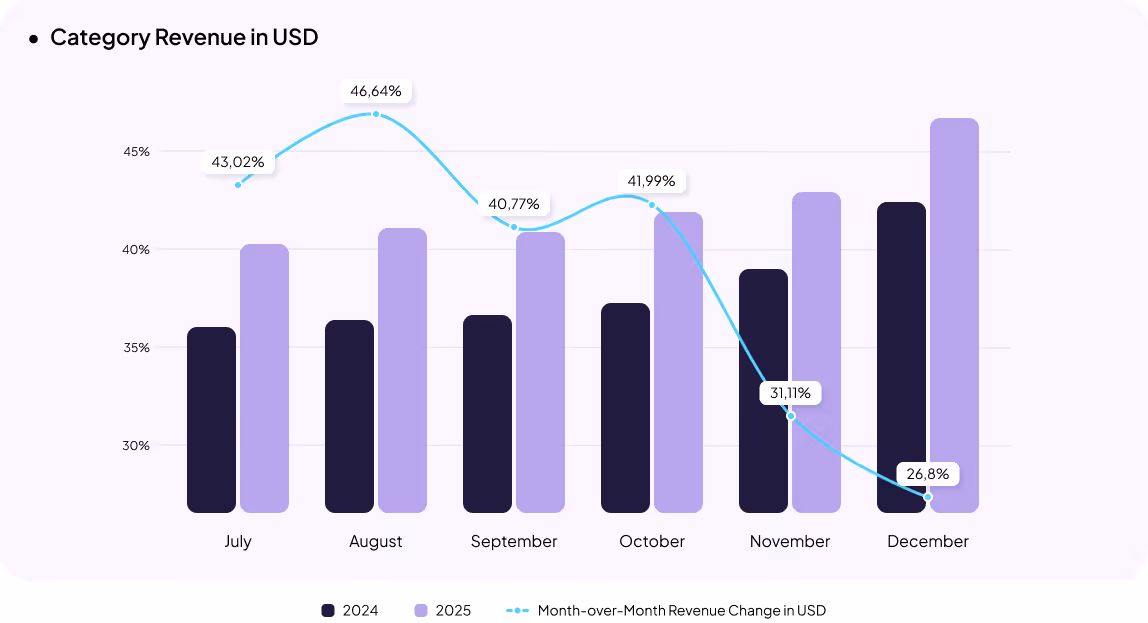
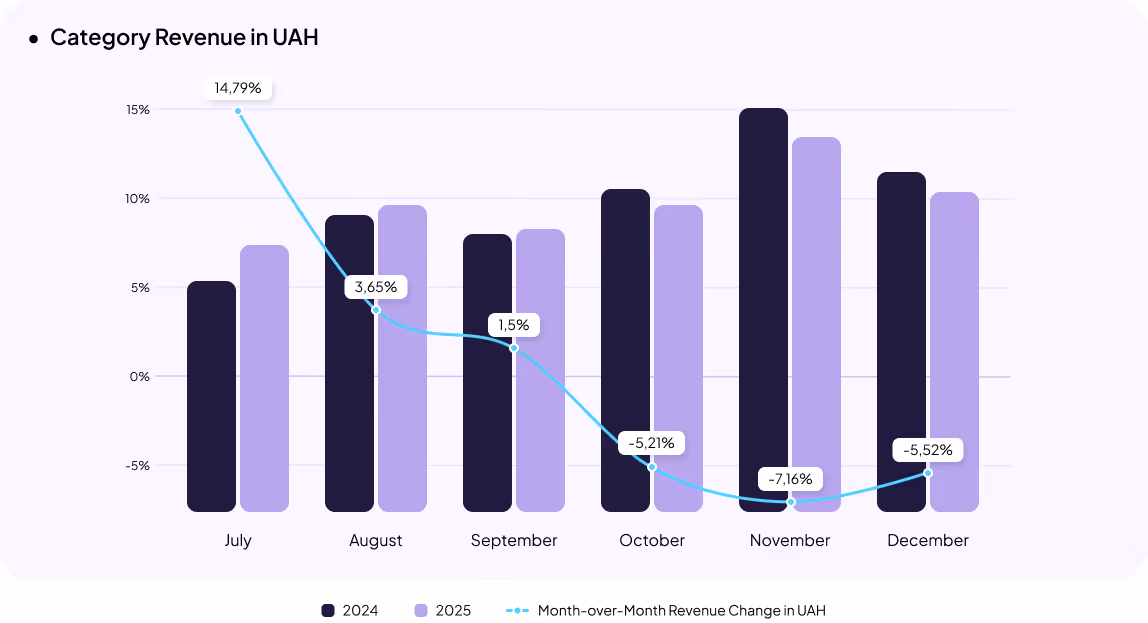
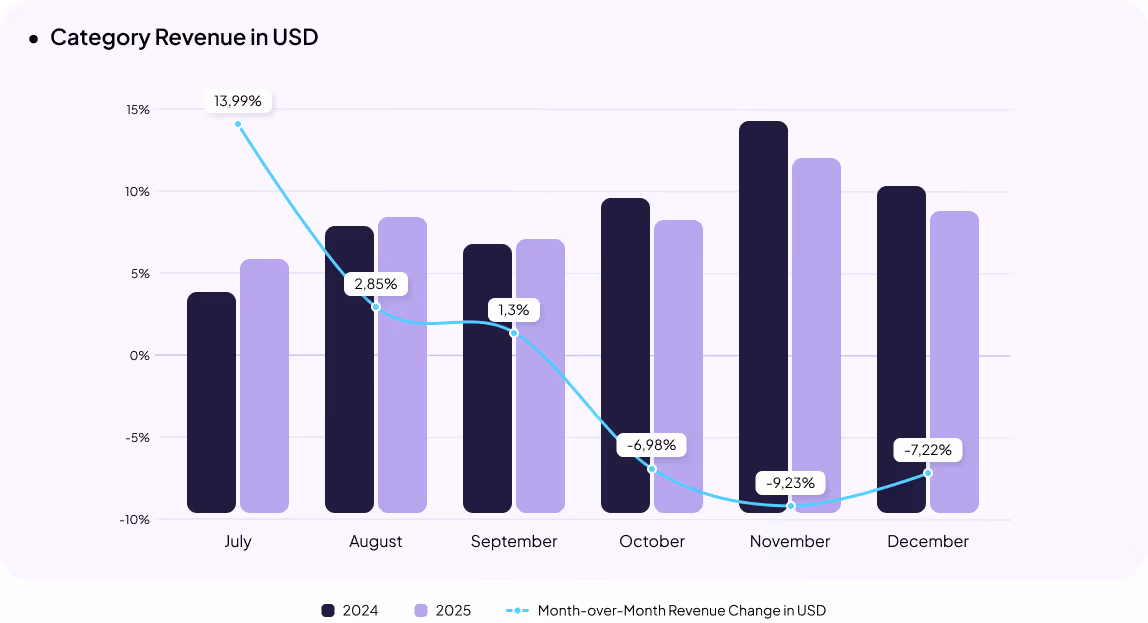
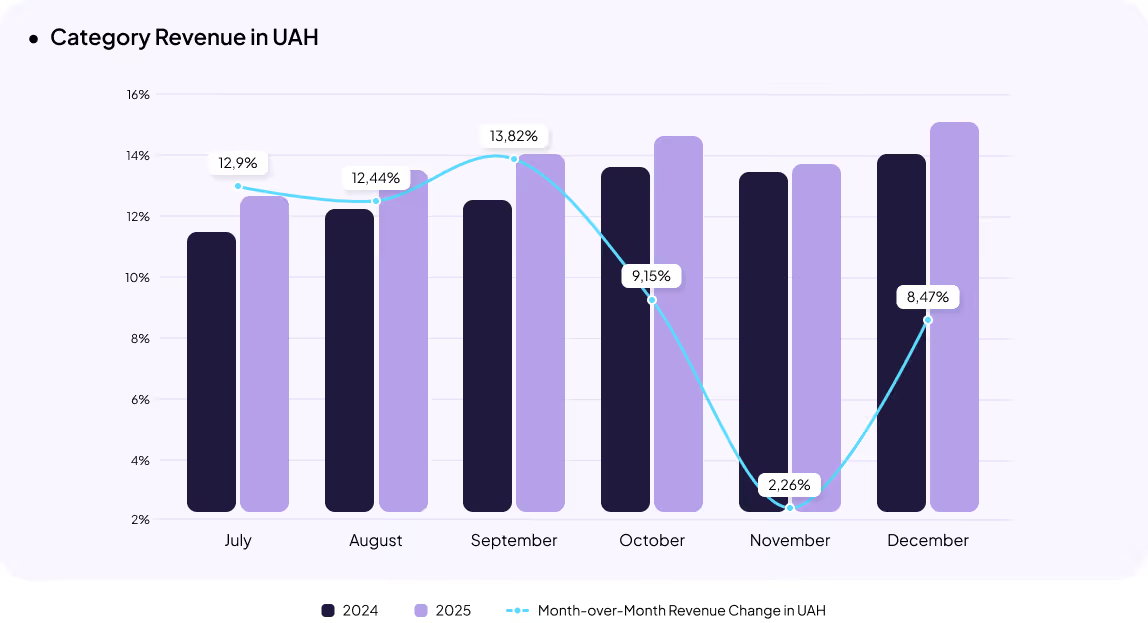
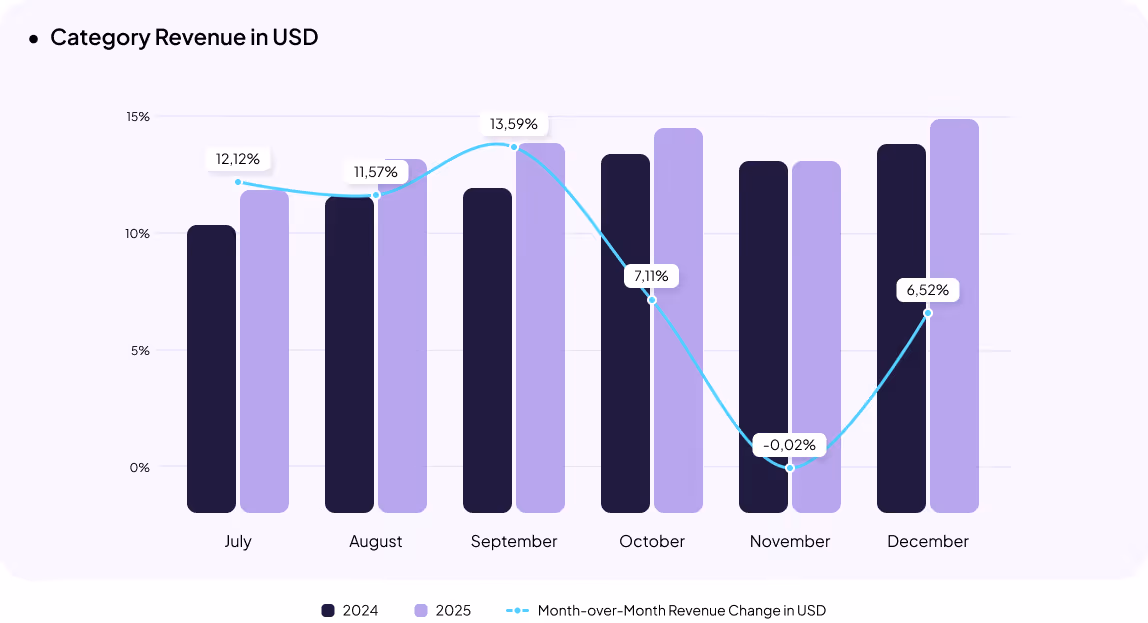
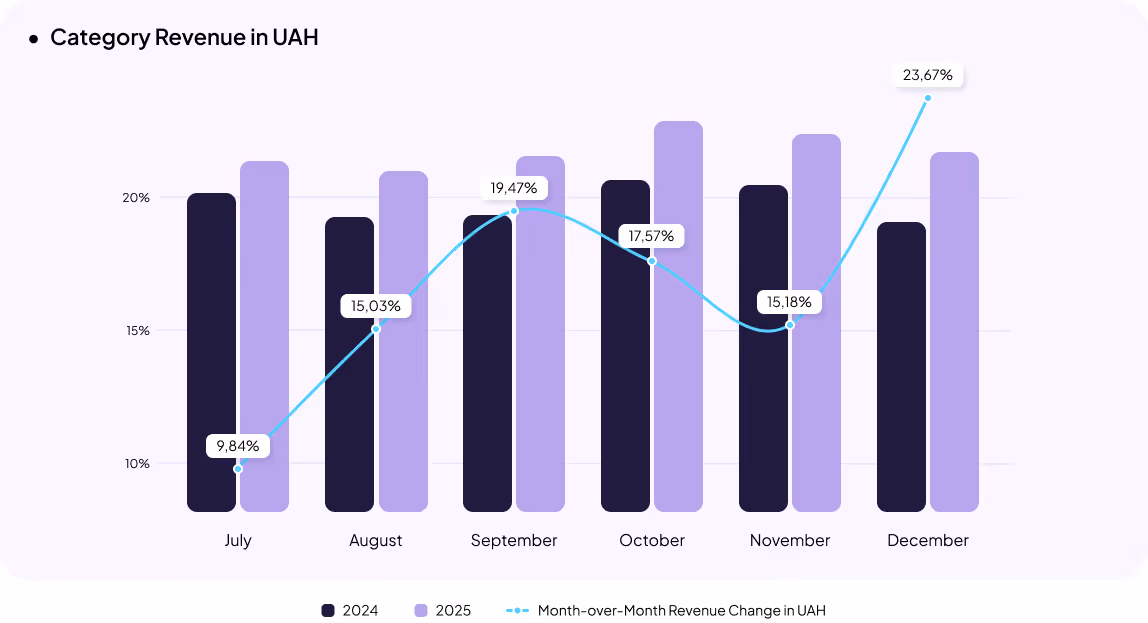
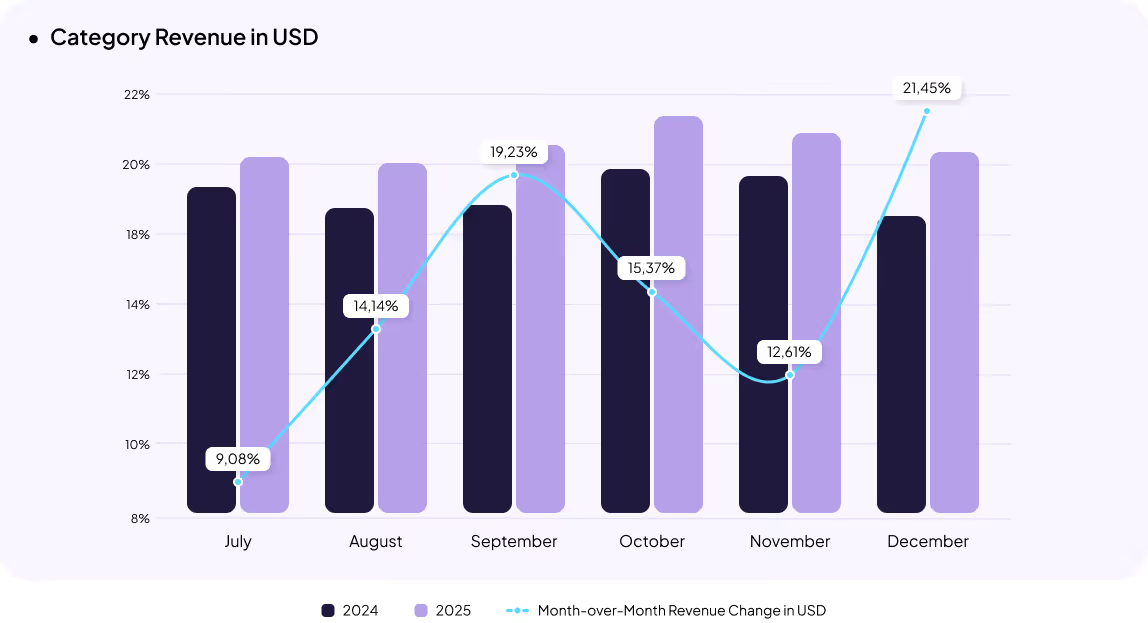
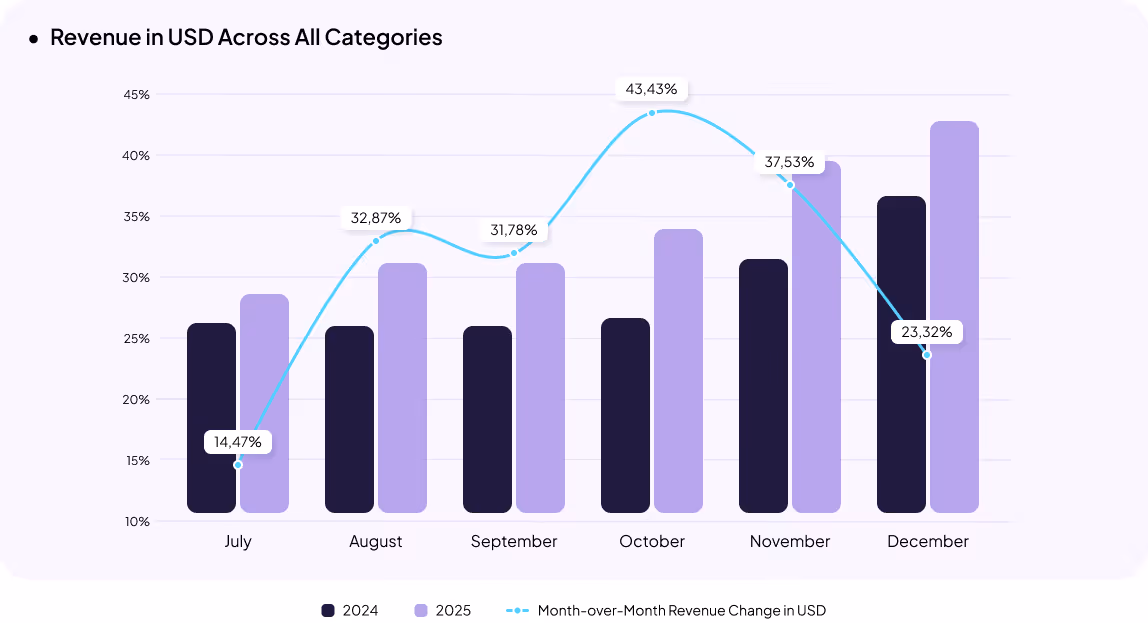
The consumer electronics category continued its growth trajectory: revenue increased by 37% in UAH and 35% in USD. The highest growth was recorded in October, likely driven by the launch of the latest iPhone models, with sales increasing more than 2.8 times.
Due to strong demand for models in updated designs and colors, shortages persisted until the end of the year. By late December, new iPhones were sold out at official retailers.
In November, revenue in USD grew by 49%, largely driven by the Black Friday effect.
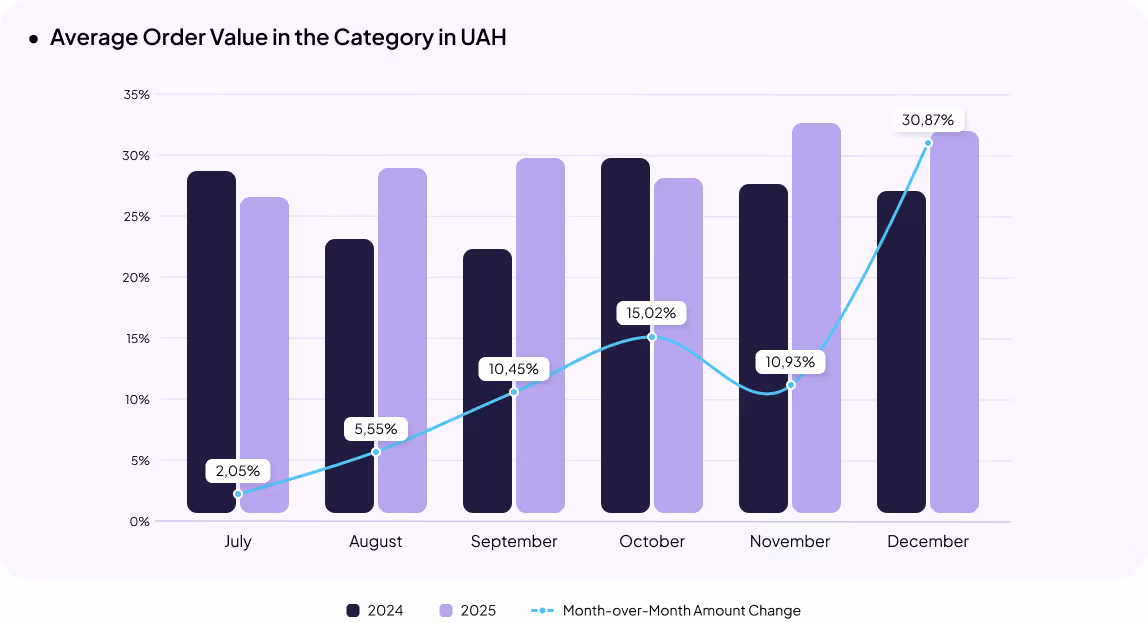
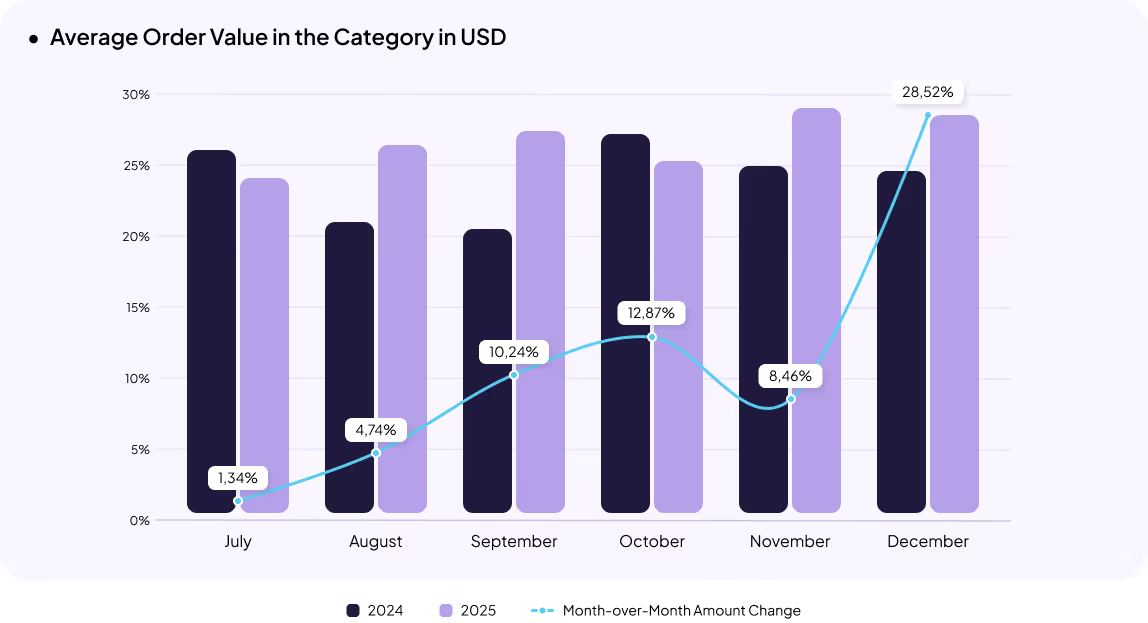
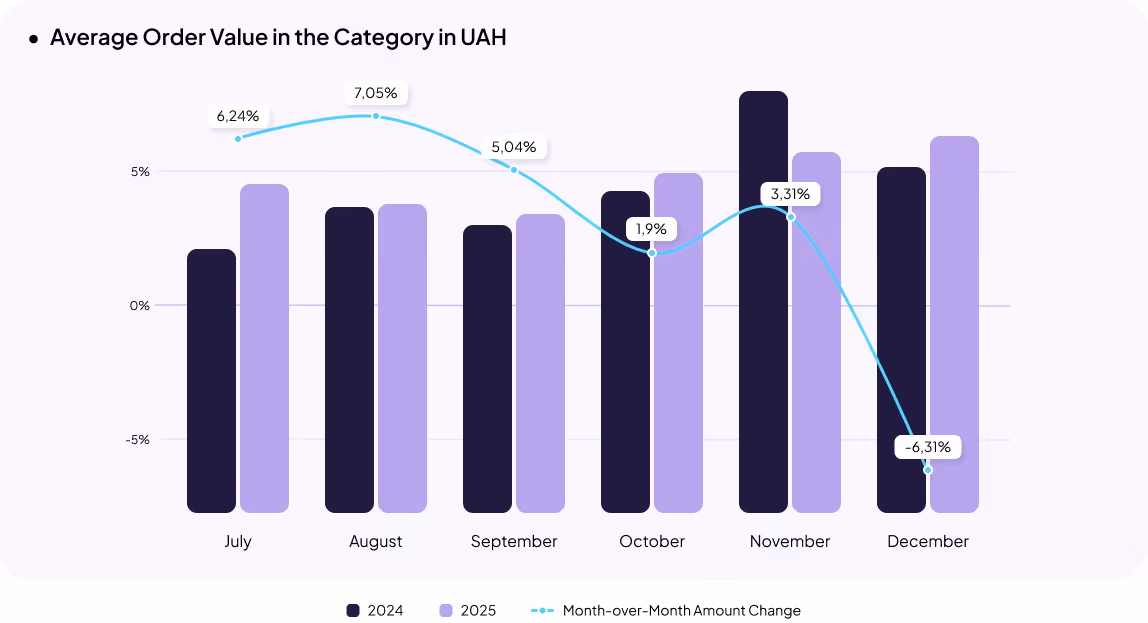
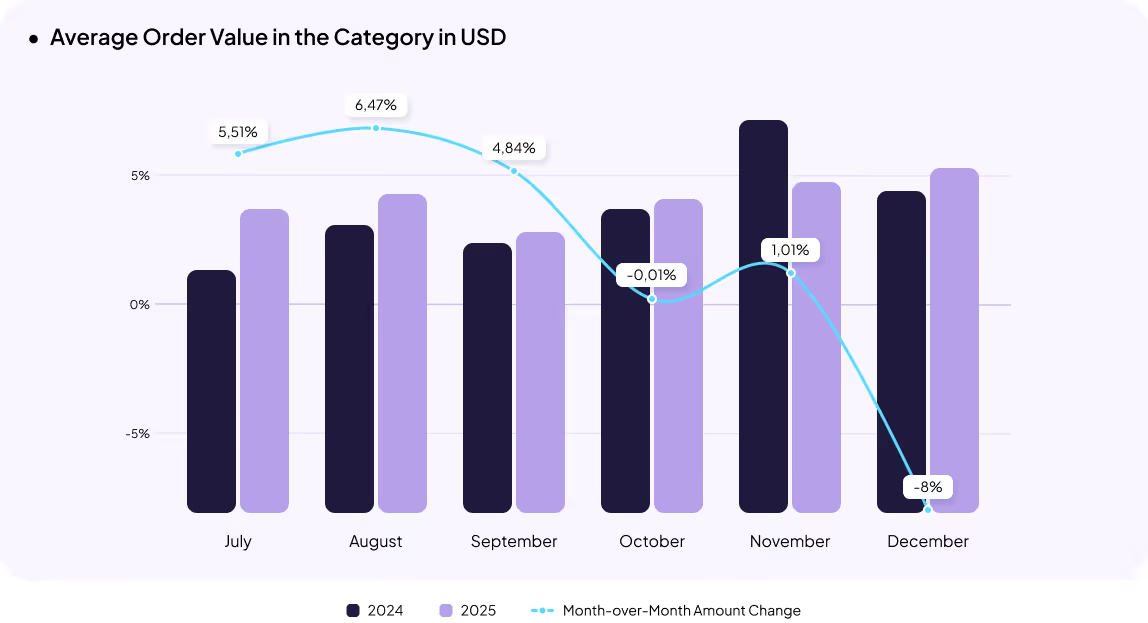
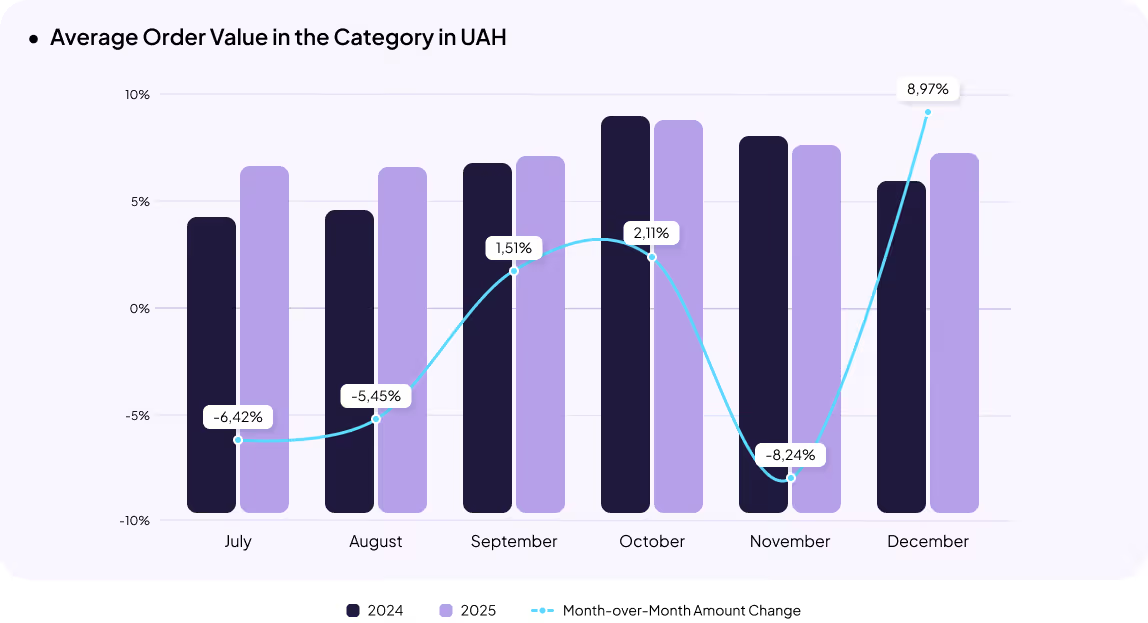
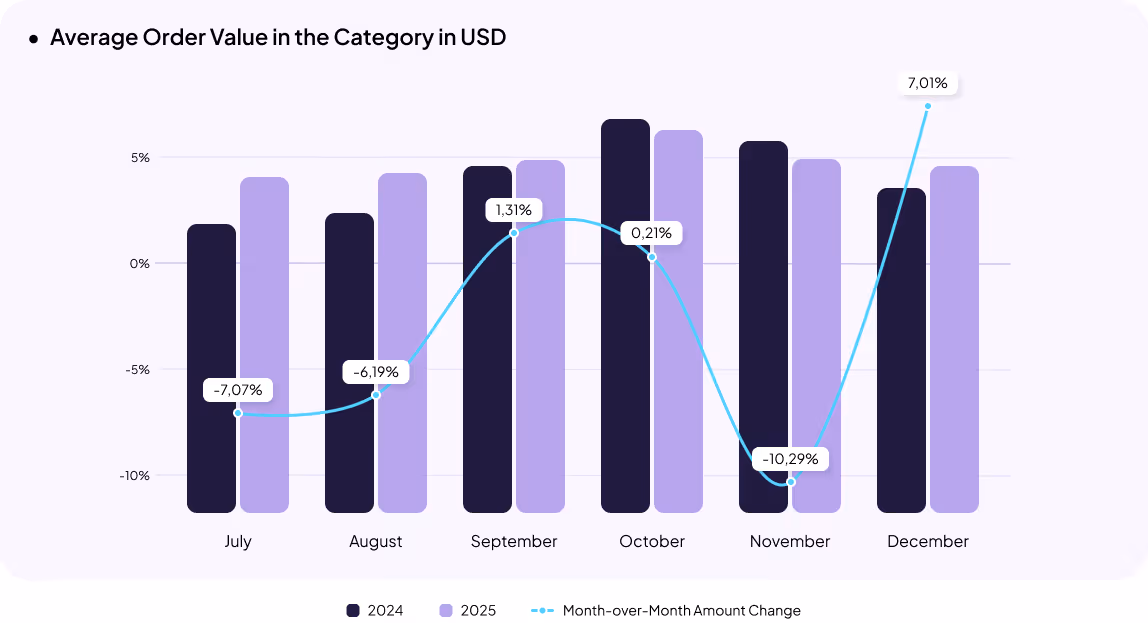
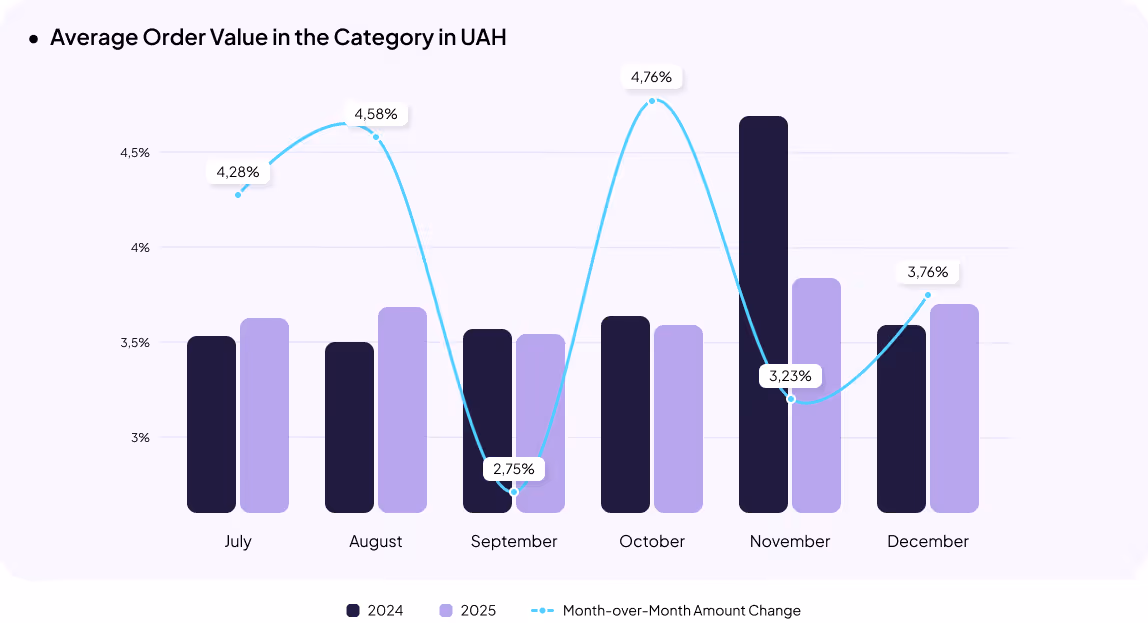
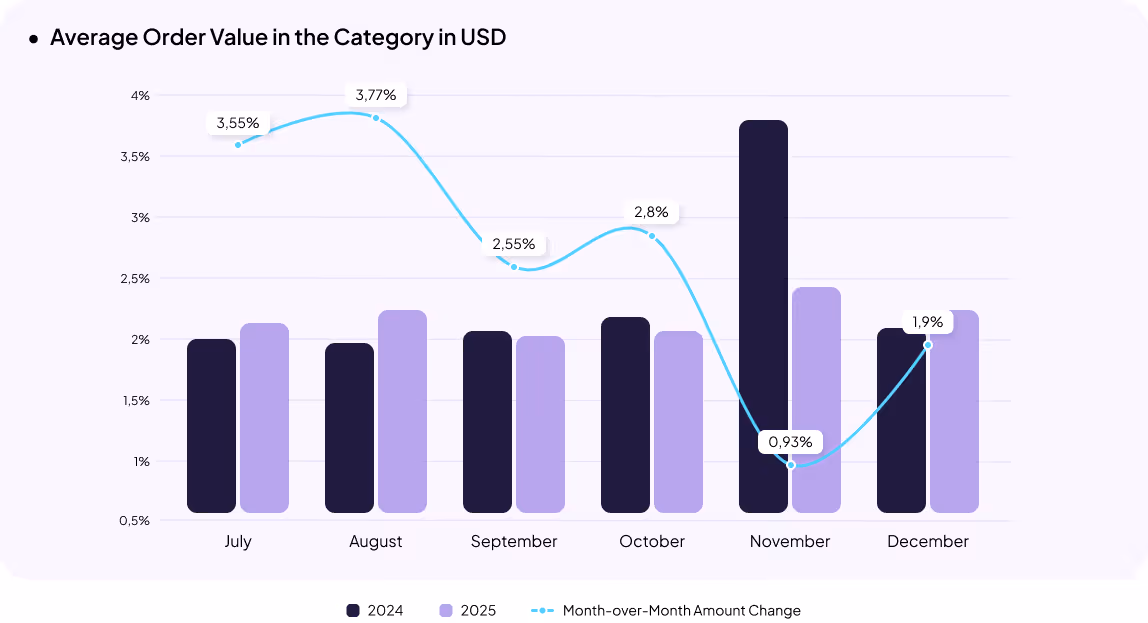
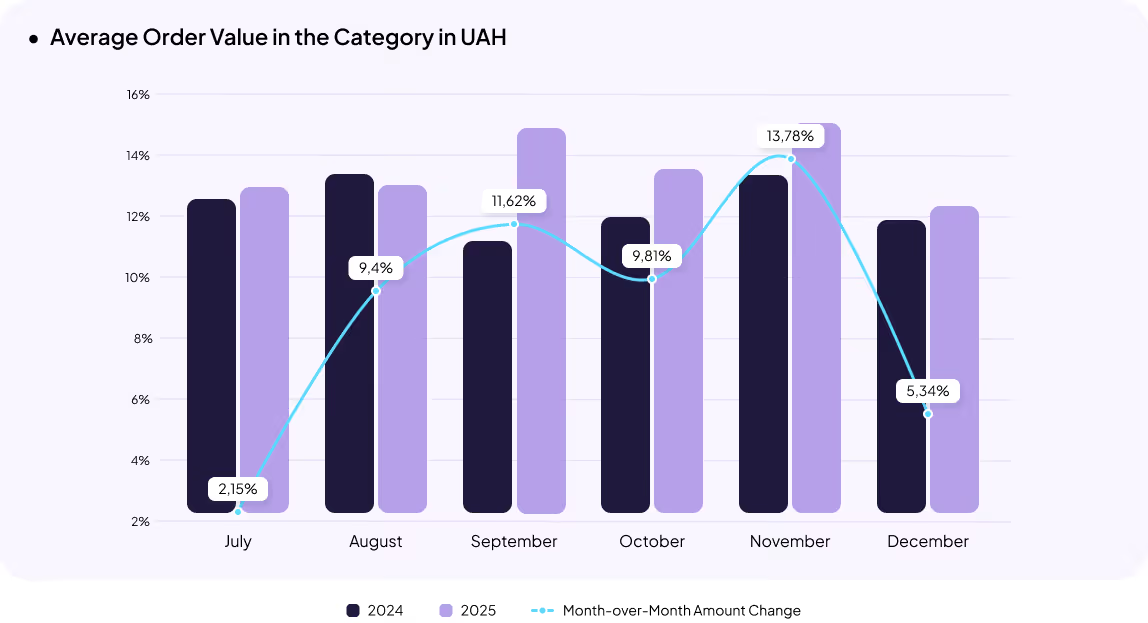
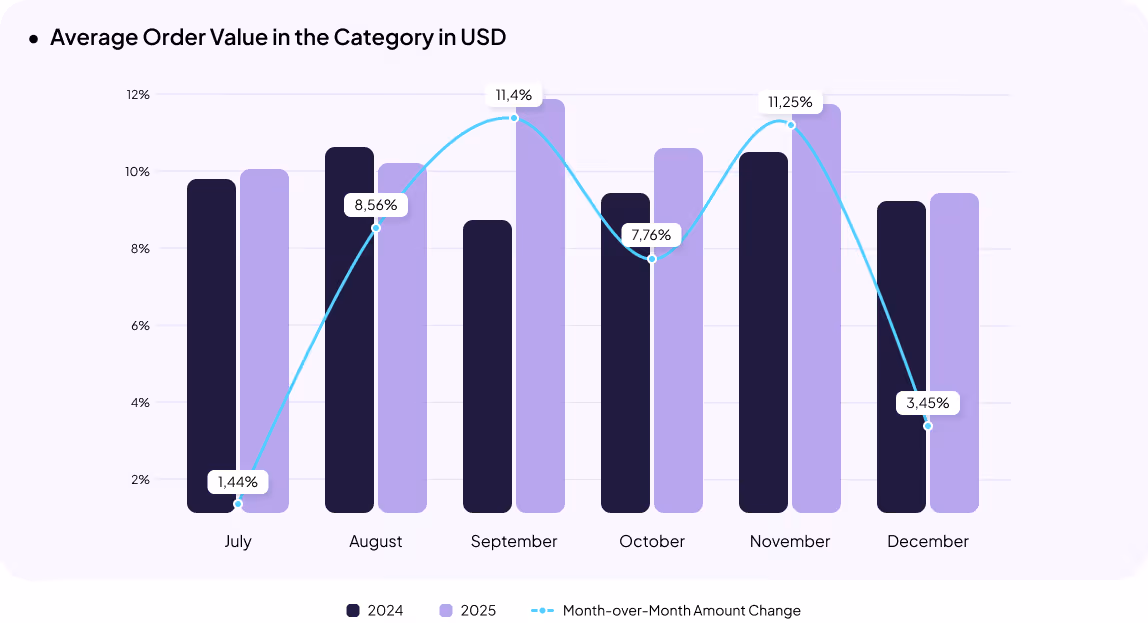
The average order value increased by 13% in USD, with the most significant growth recorded in December (+29%). Despite this, the number of purchases in December slightly declined by 1%, while the average growth for the second half of the year reached 19%.
This suggests that the increase in average order value was partly driven by higher prices for power supply devices starting in October–November, including charging stations and power banks, amid rising demand during this period. Unit sales of charging stations and generators increased by 54%.
The conversion rate rose by 4%, indicating improved traffic quality and a higher likelihood of purchases. Overall traffic volume grew by 15%, with the strongest growth in Q4 (+21%). This correlates with increased advertising spend, which rose by 26% in USD over the half-year.
The second half of 2025 confirmed the hypothesis: when choosing electronics, Ukrainian consumers are more likely to click on paid advertising than organic search results. As a result, paid channels drove the majority of both traffic growth and revenue.
The cost per click remained stable throughout the period despite increased budgets. Growth in traffic and revenue was primarily fueled by paid channels.
[[SLIDER-START]]
[[SLIDER-END]]
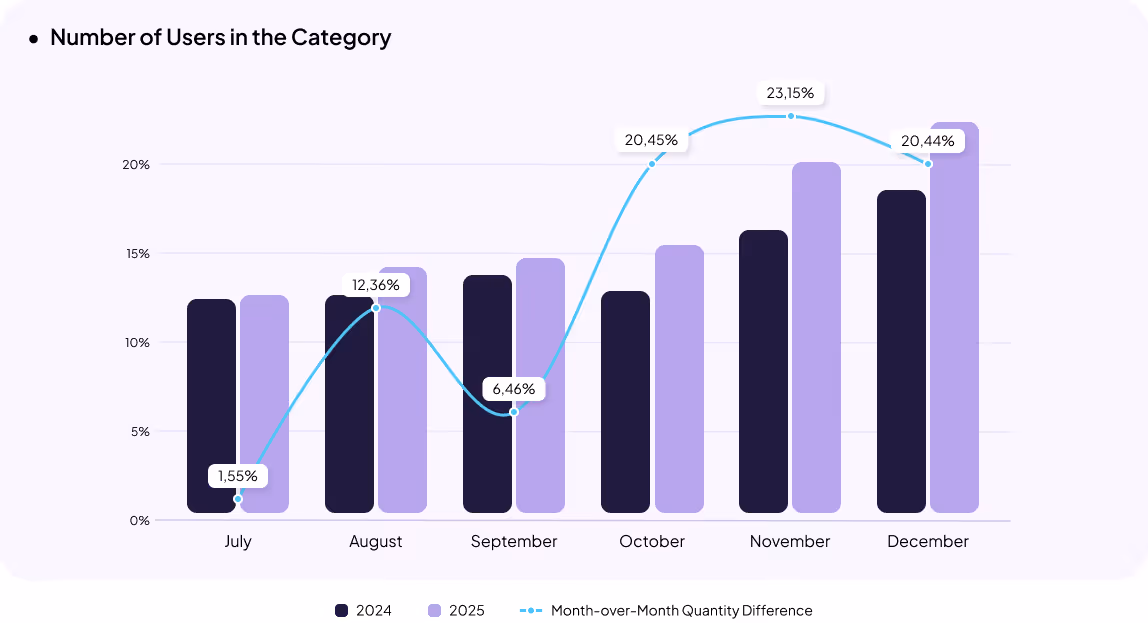
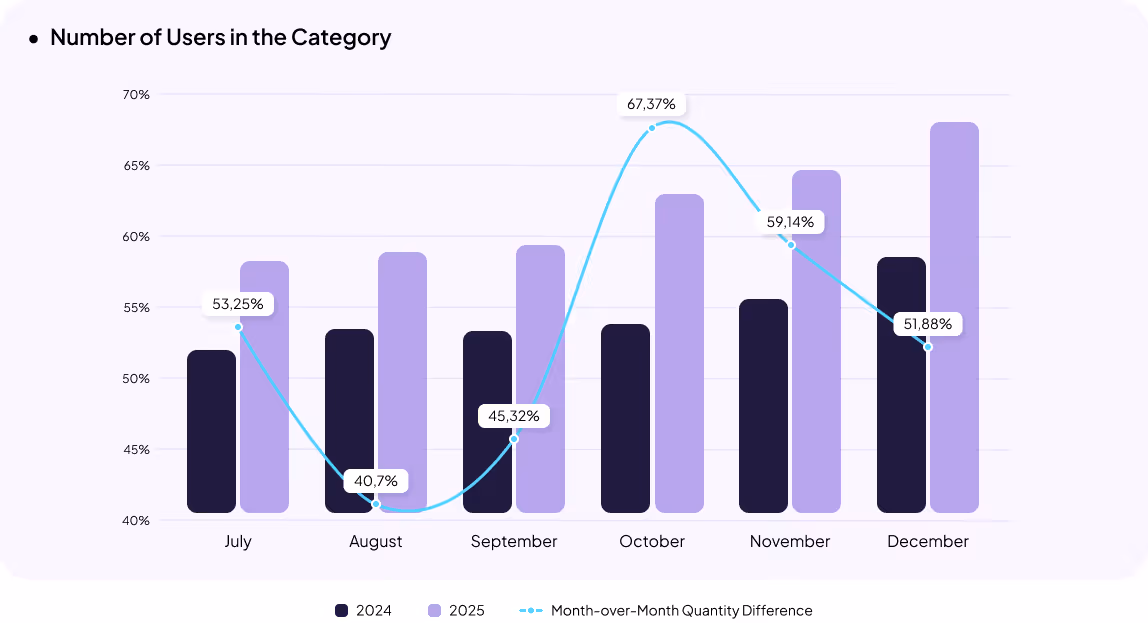
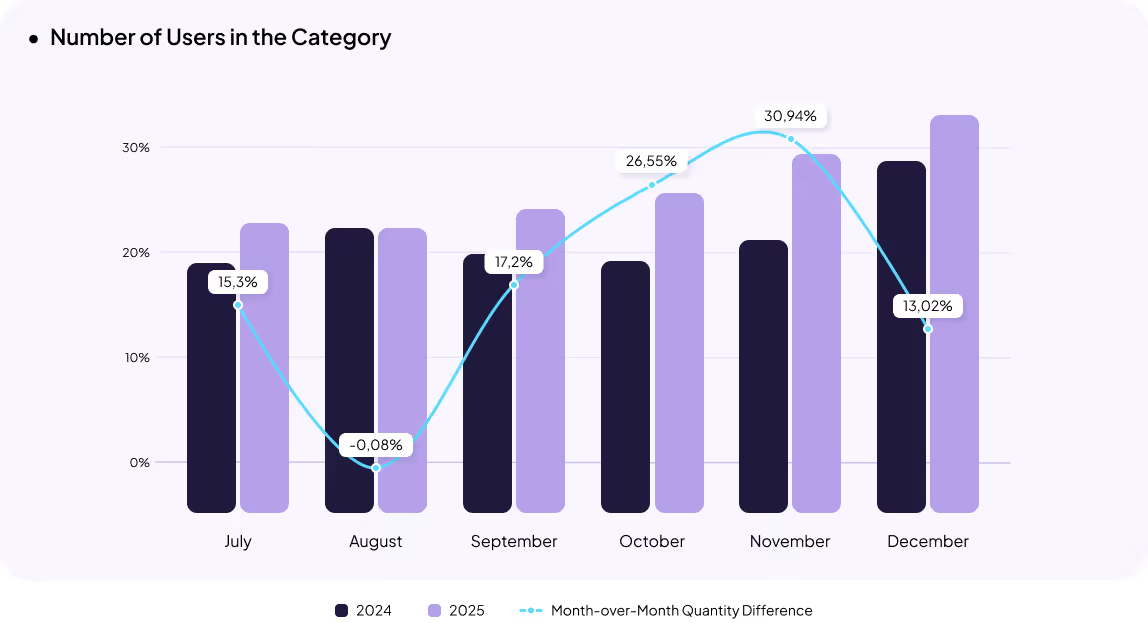
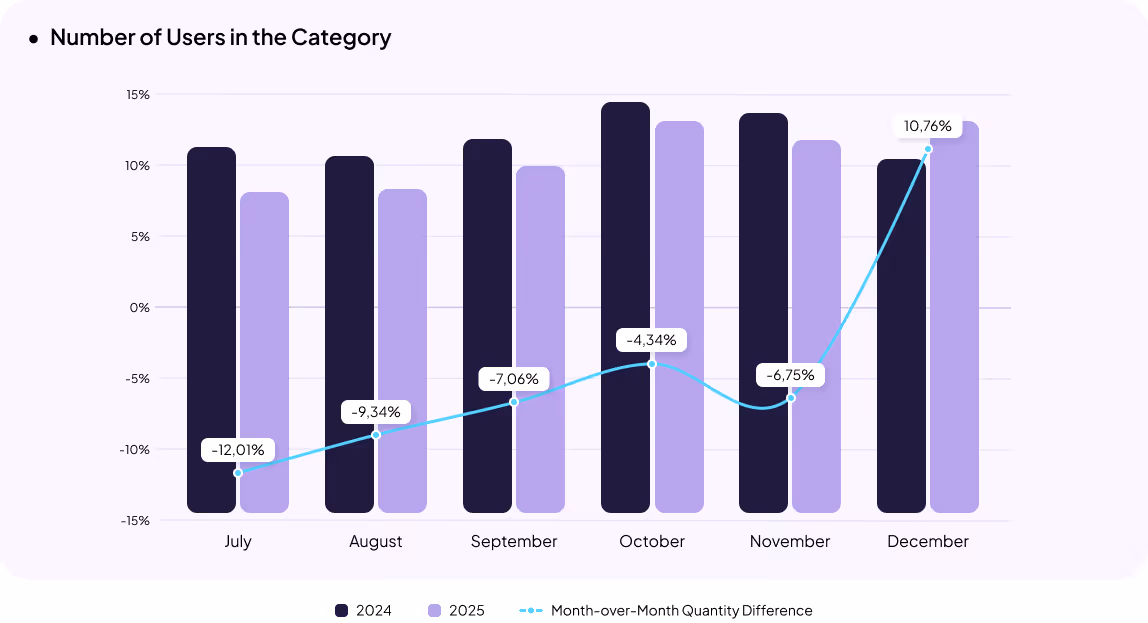
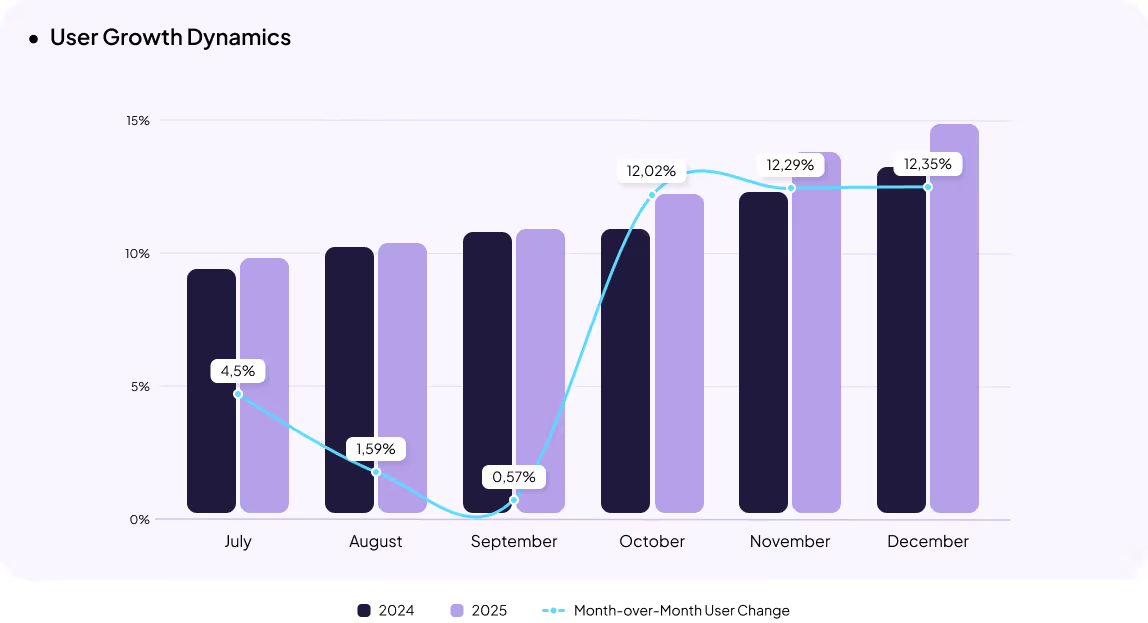
Penetration in the food and beverages category continues to grow: traffic increased by 53%, with the strongest growth observed starting in October. The number of purchases rose by 36%.
Hypothesis: consumer behavior is shifting, and new online habits are forming. Users are increasingly choosing online shopping, accompanied by rising demand for delivery services.
Category revenue grew by 39% in UAH and 37% in USD. At the same time, the average order value remained almost unchanged (+2% in UAH and +1% in USD). Given the relative stability of the USD exchange rate during the second half of the year, revenue and AOV dynamics cannot be attributed to currency fluctuations.
The conversion rate decreased by 11%, as traffic in the category grew faster than the number of purchases. New visitors were more likely to browse the assortment but did not always complete a purchase, which led to a decline in CR.
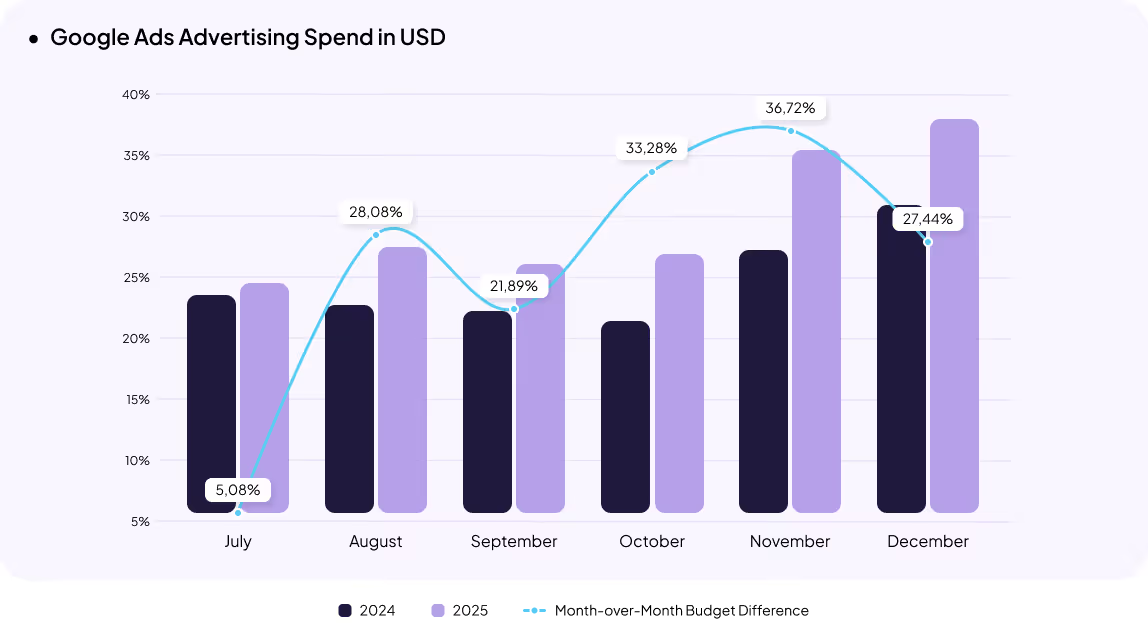
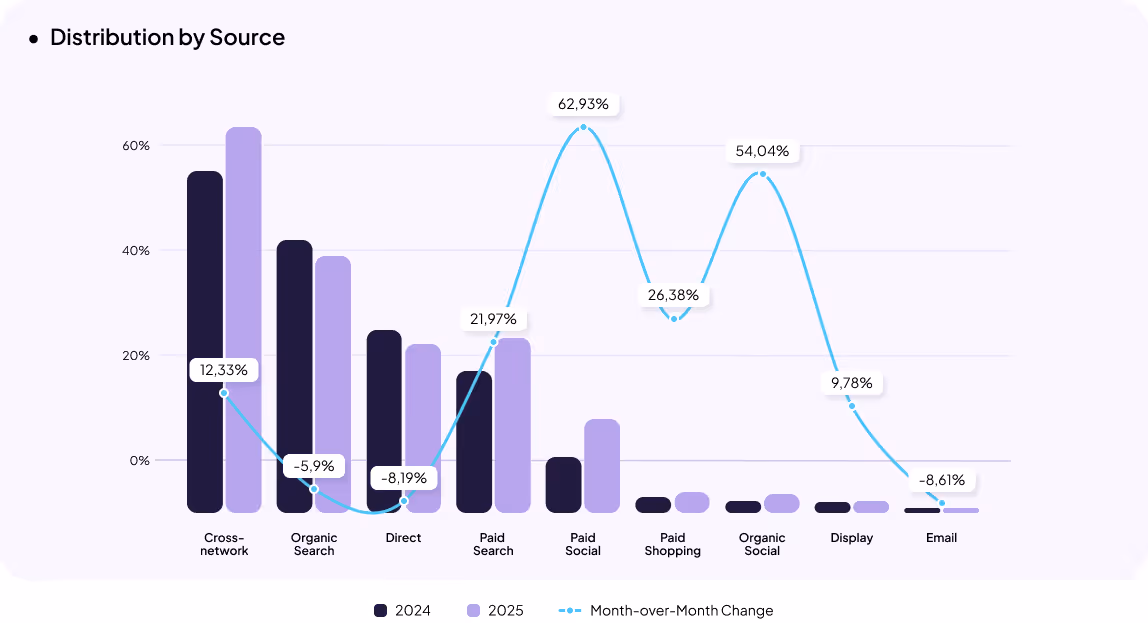
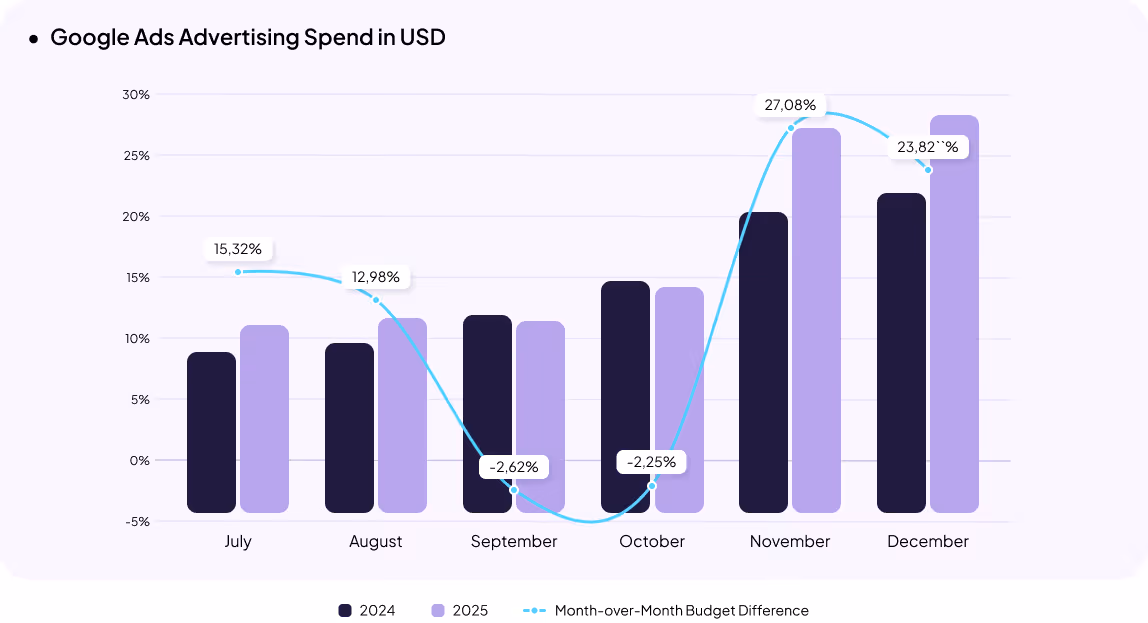
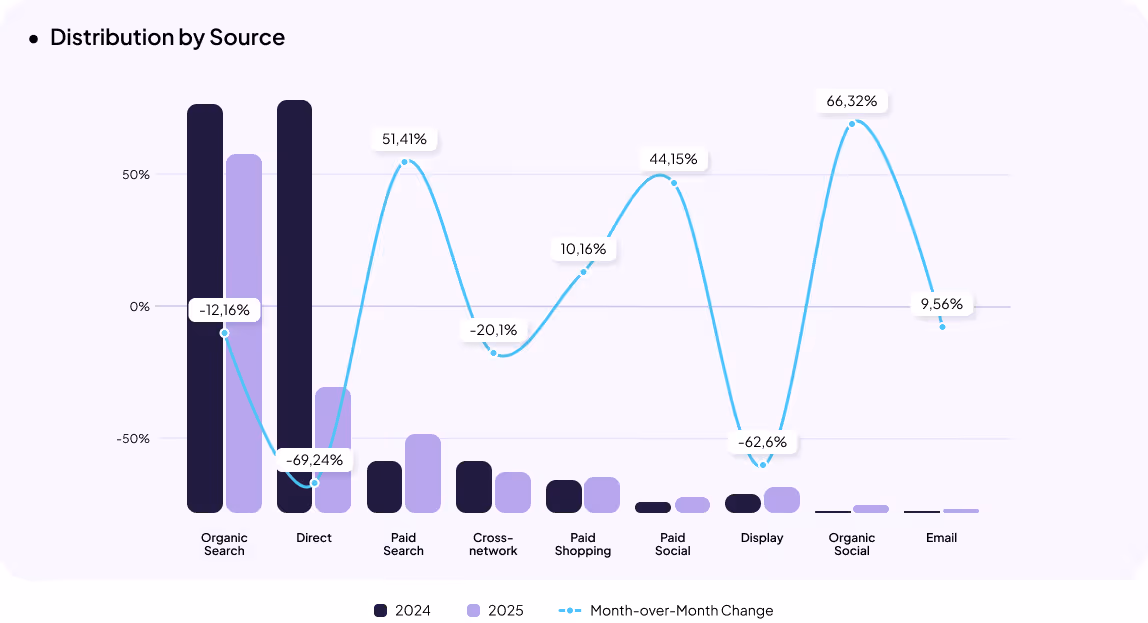
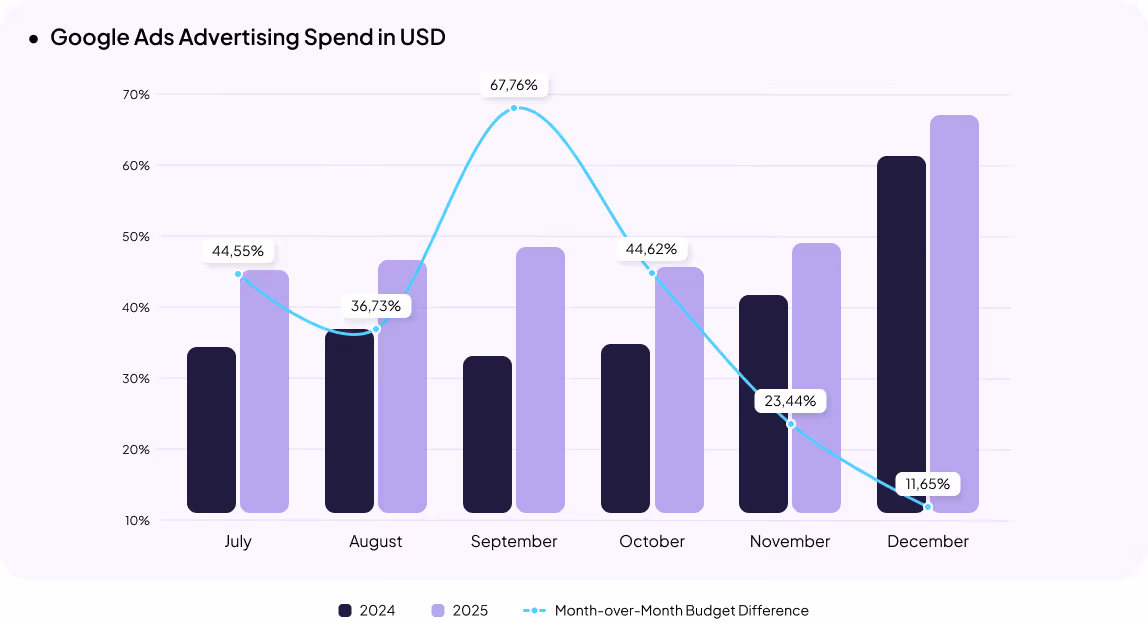
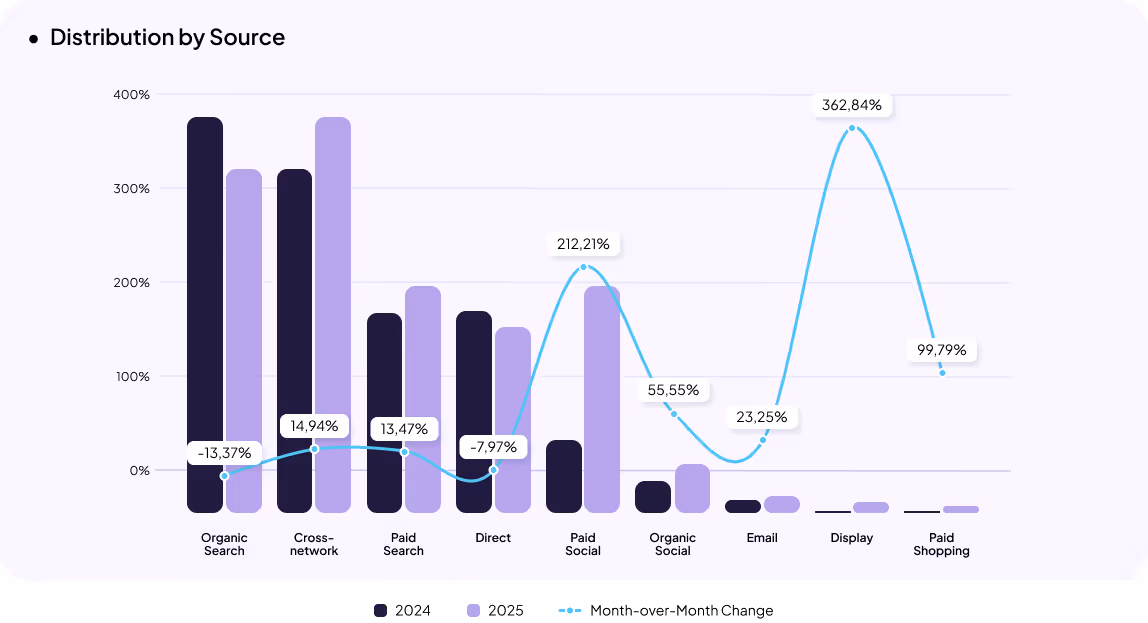
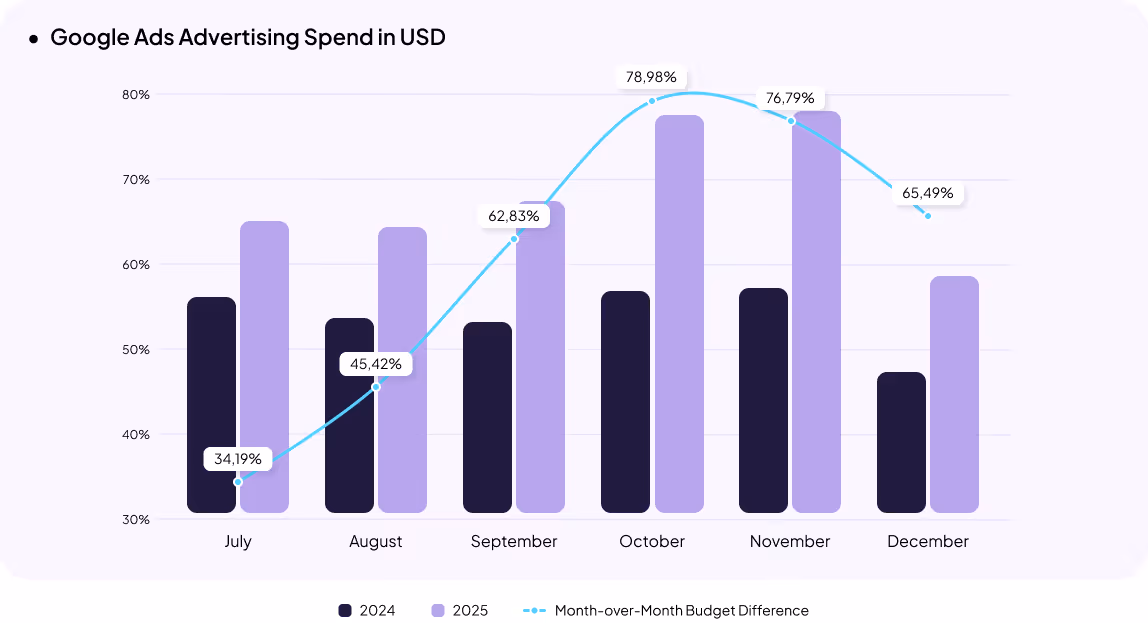
All channels demonstrated positive growth. The largest traffic increase came from organic social and paid channels. Notably, advertising budgets grew by only 14%, indicating high traffic acquisition efficiency.
Within the paid traffic structure, the share of Shopping campaigns increased significantly — from 6% to 30% — primarily due to more active use of Performance Max.
Overall, the category’s growth was driven by traffic and purchase volume rather than by an increase in average order value.
[[SLIDER-START]]
[[SLIDER-END]]
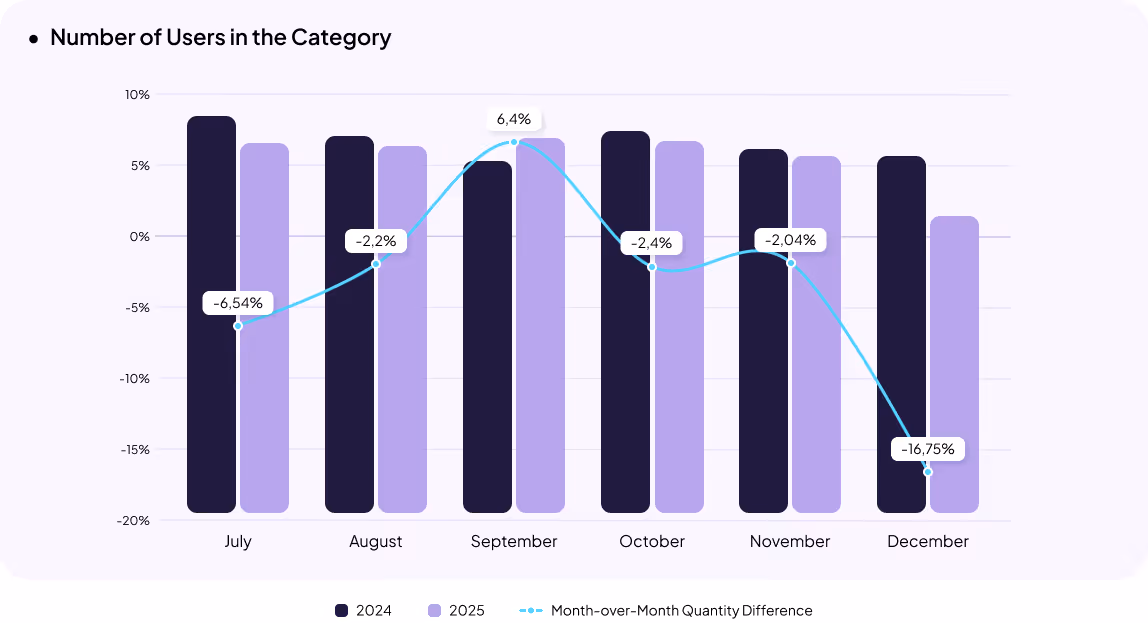
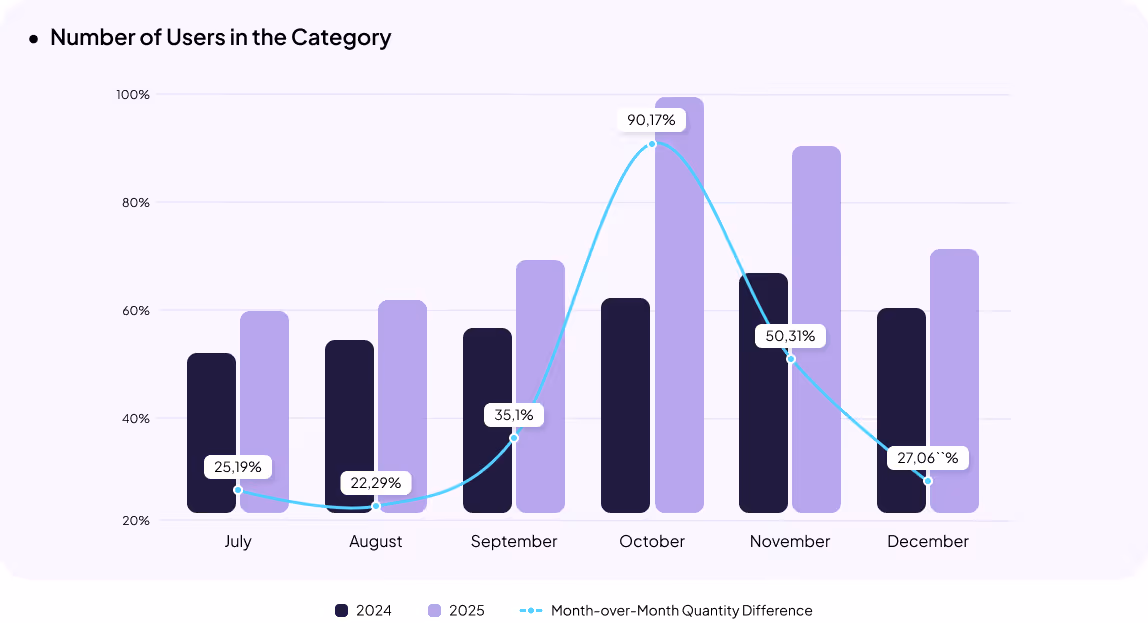
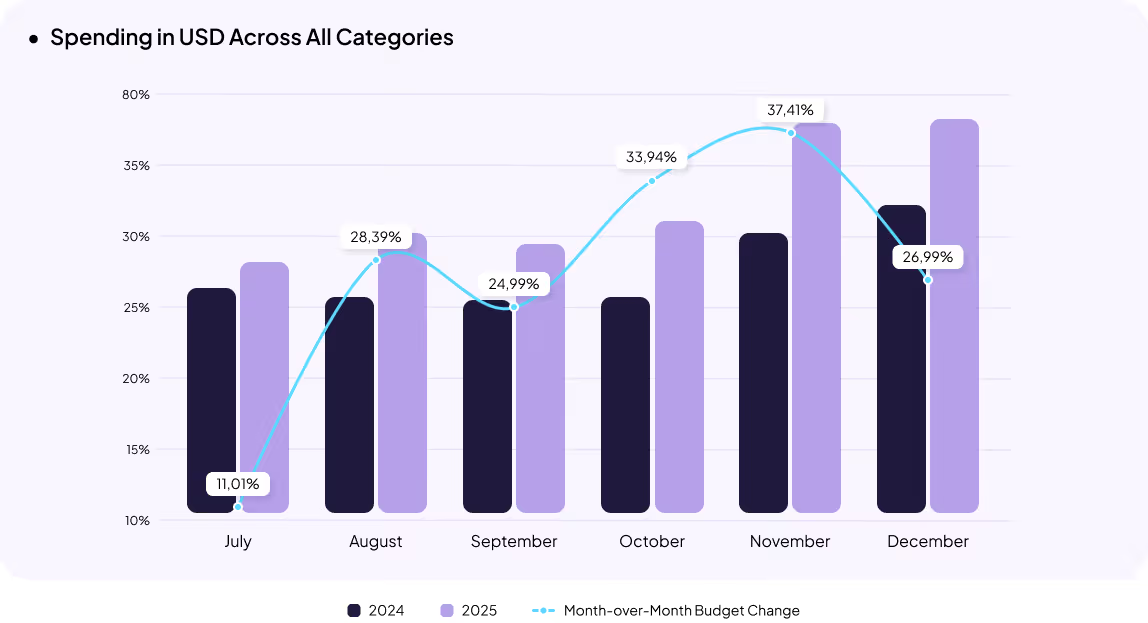
In the second half of 2025, revenue in the pet supplies category continued to grow: +51% in UAH and +49% in USD compared to the first half of the year. However, growth rates slowed in Q4, and by the end of the year, the dynamics were weaker than in 2024.
The number of purchases increased by 35% and continues to rise. The average order value grew moderately, +12% in UAH and +10% in USD. In the last quarter, growth rates were lower than in previous periods. By the end of 2025, the category showed a slowdown compared to 2024.
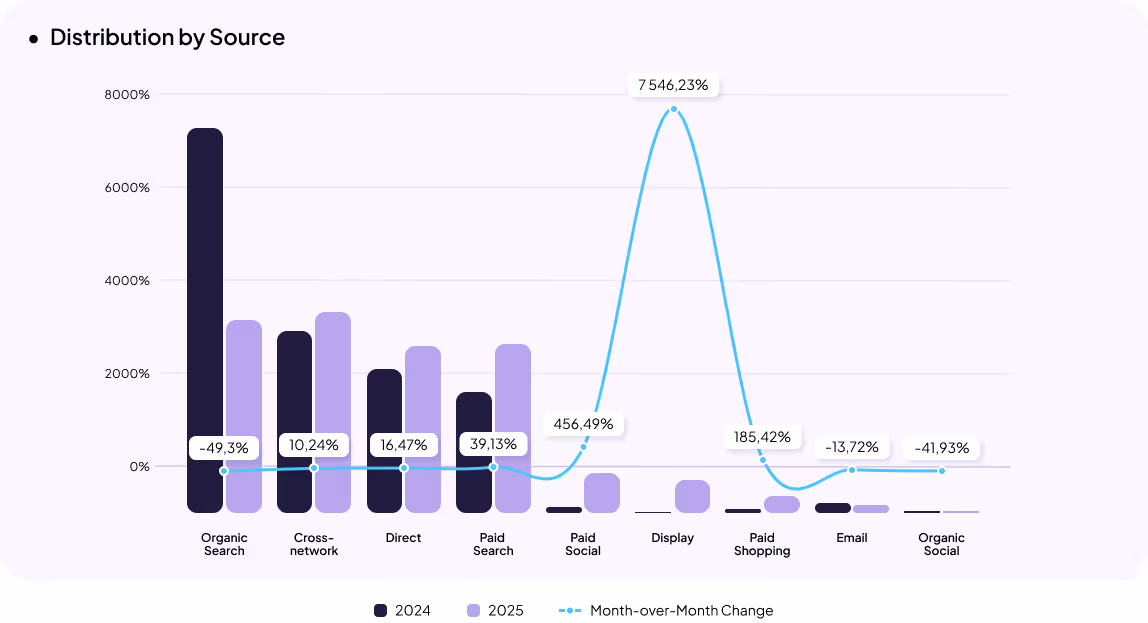
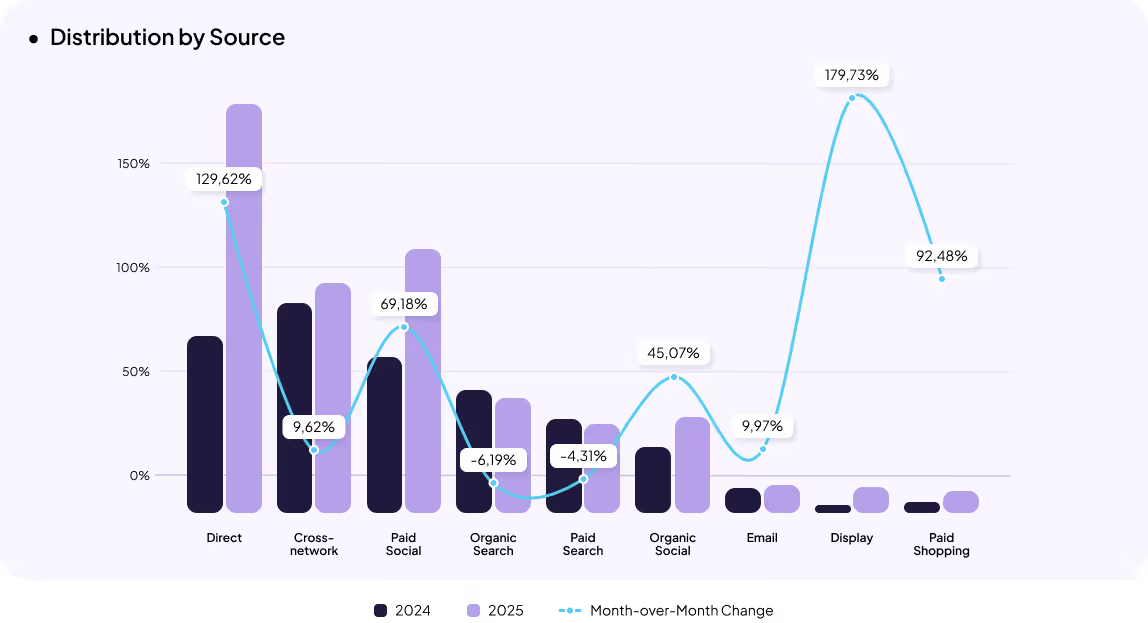
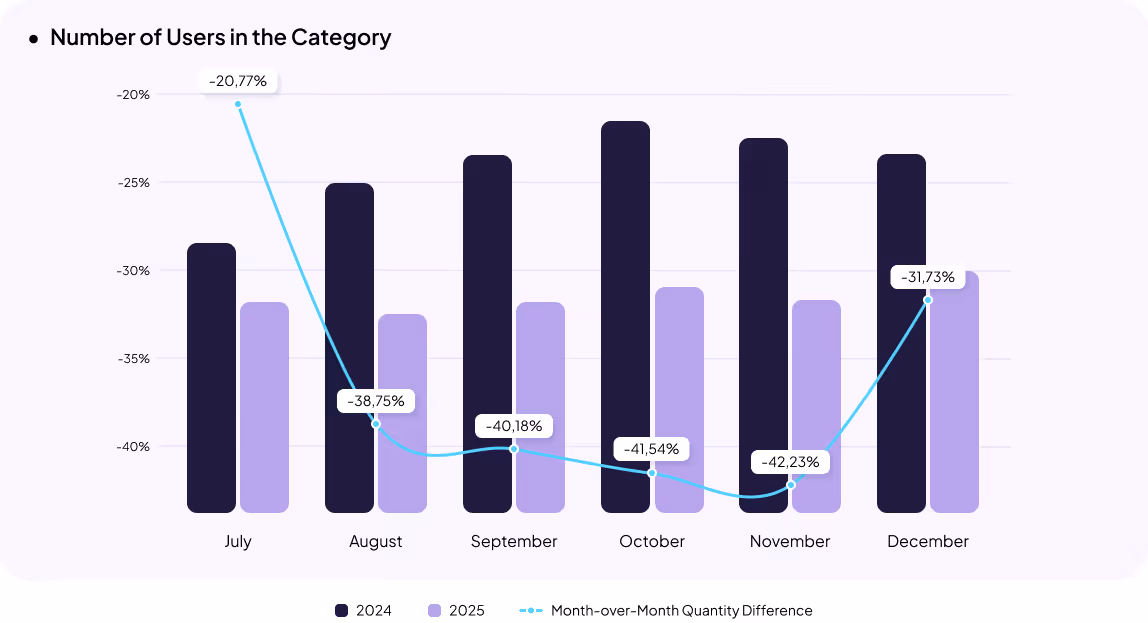
The conversion rate increased by 41%, indicating highly efficient traffic. The trend remains consistent: overall traffic volume is decreasing, the number of new users is not growing, and the majority of traffic is driven by returning customers.
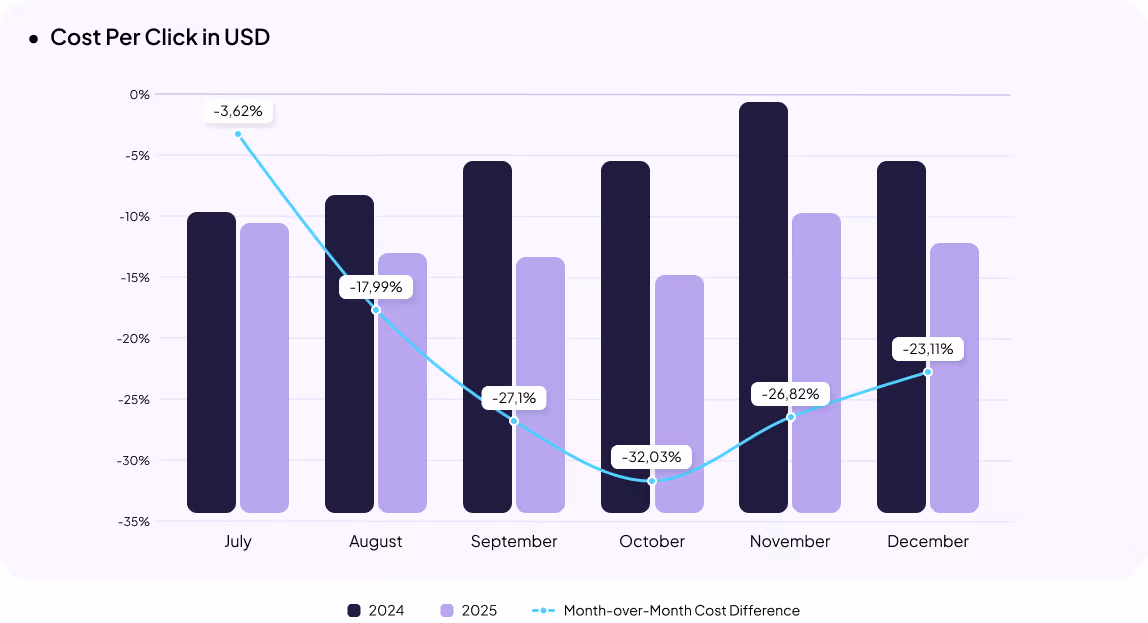
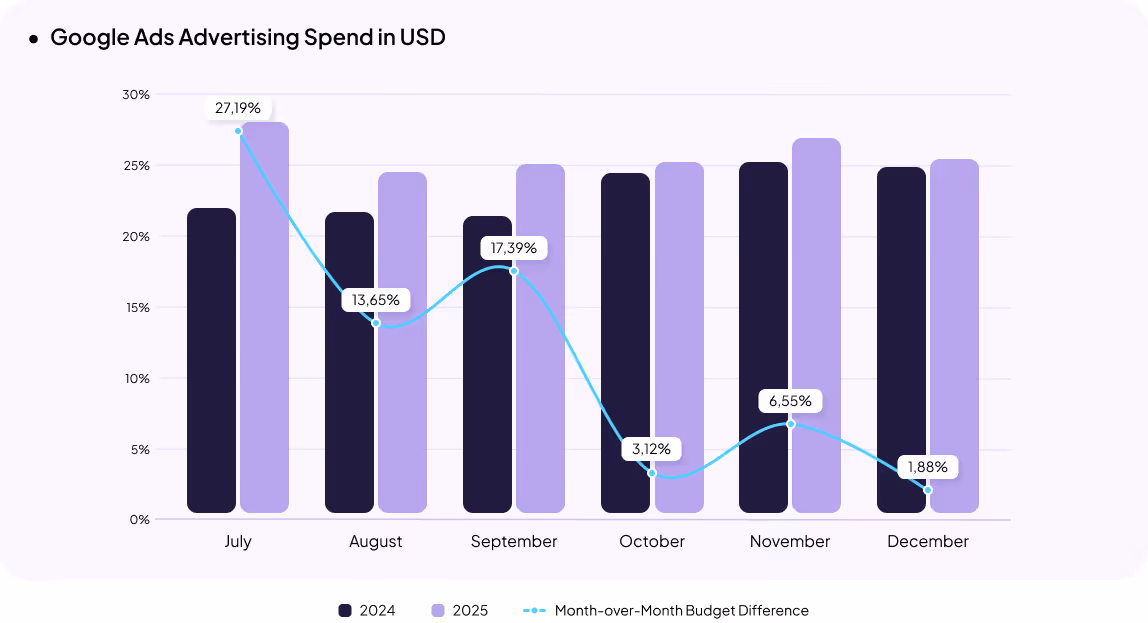
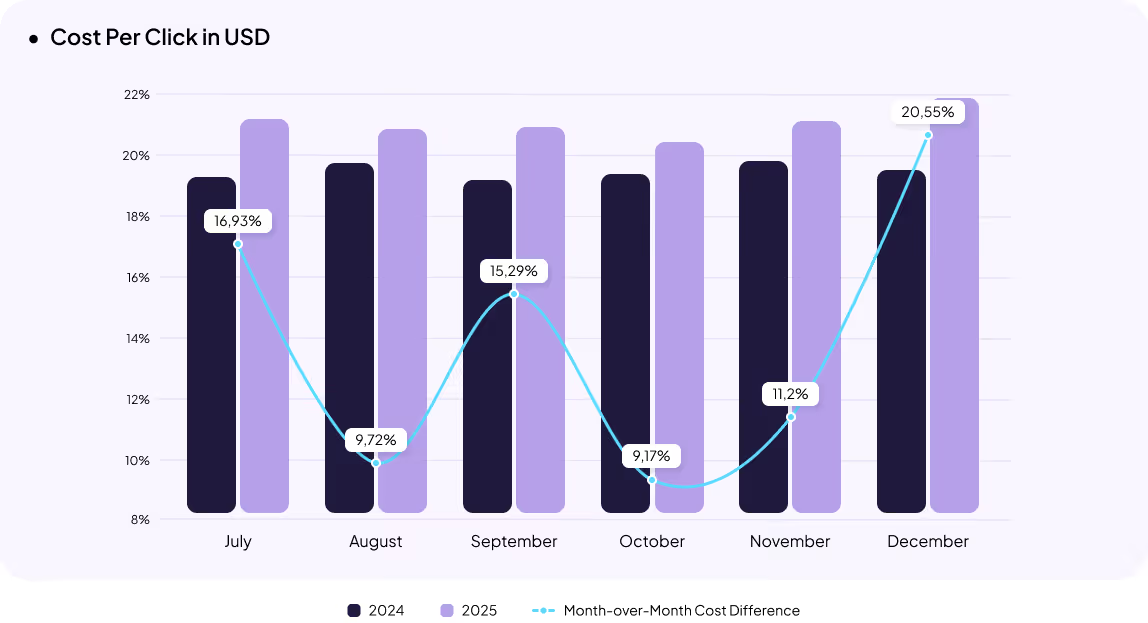
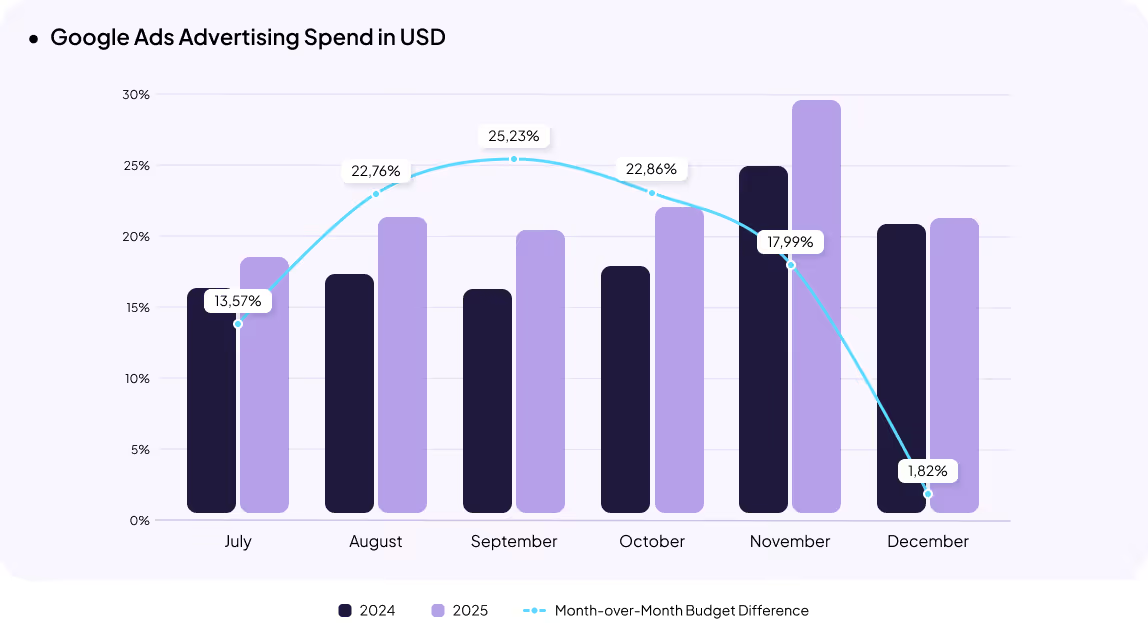
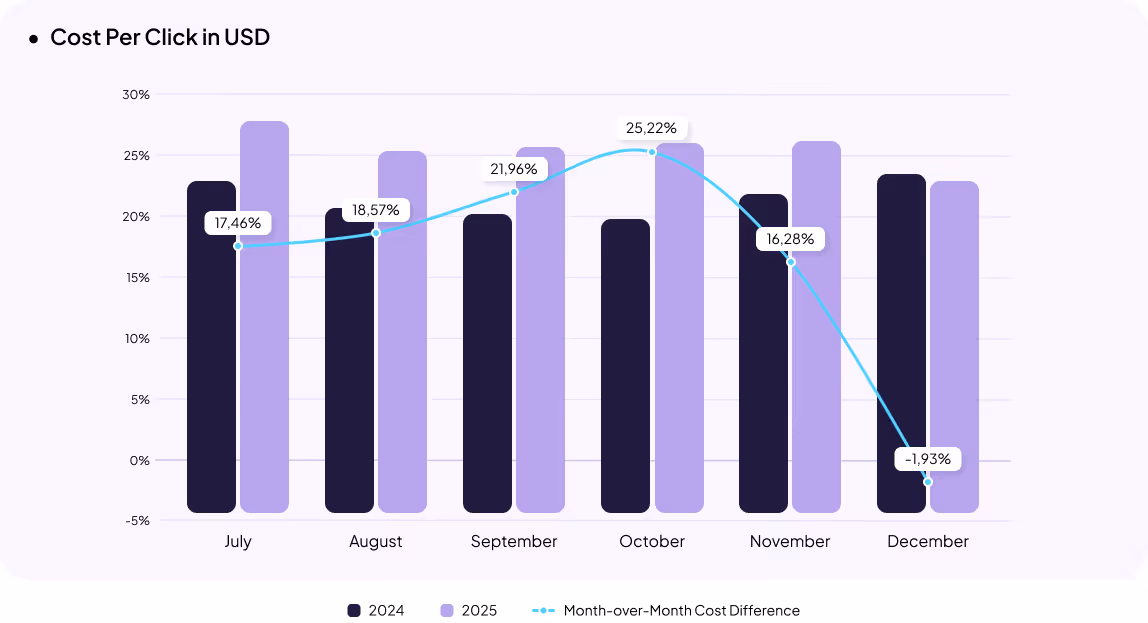
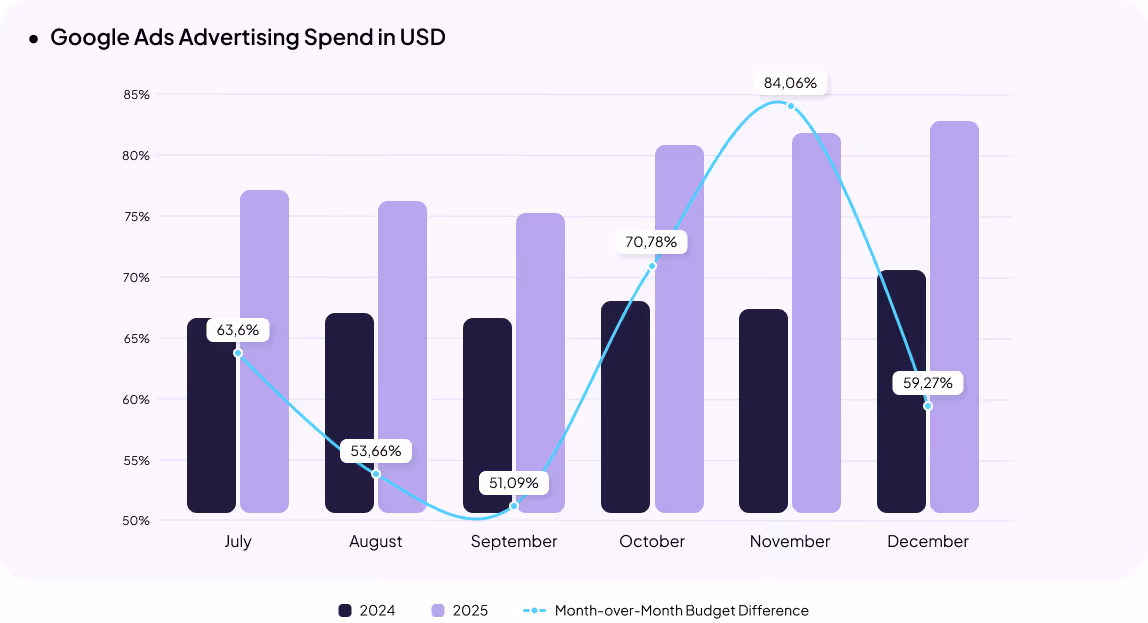
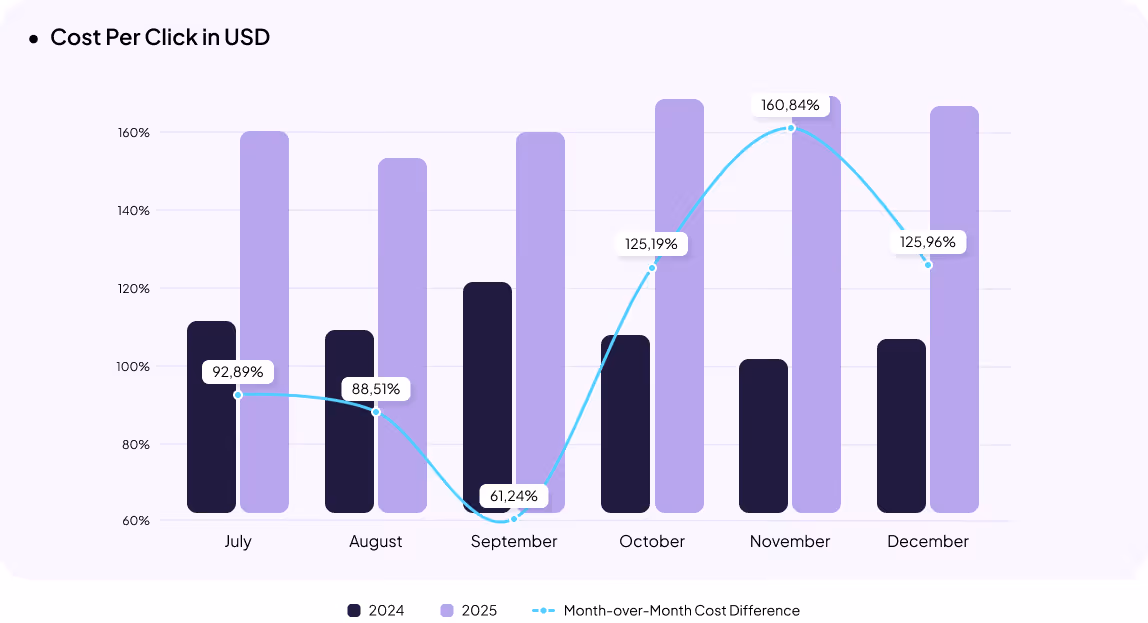
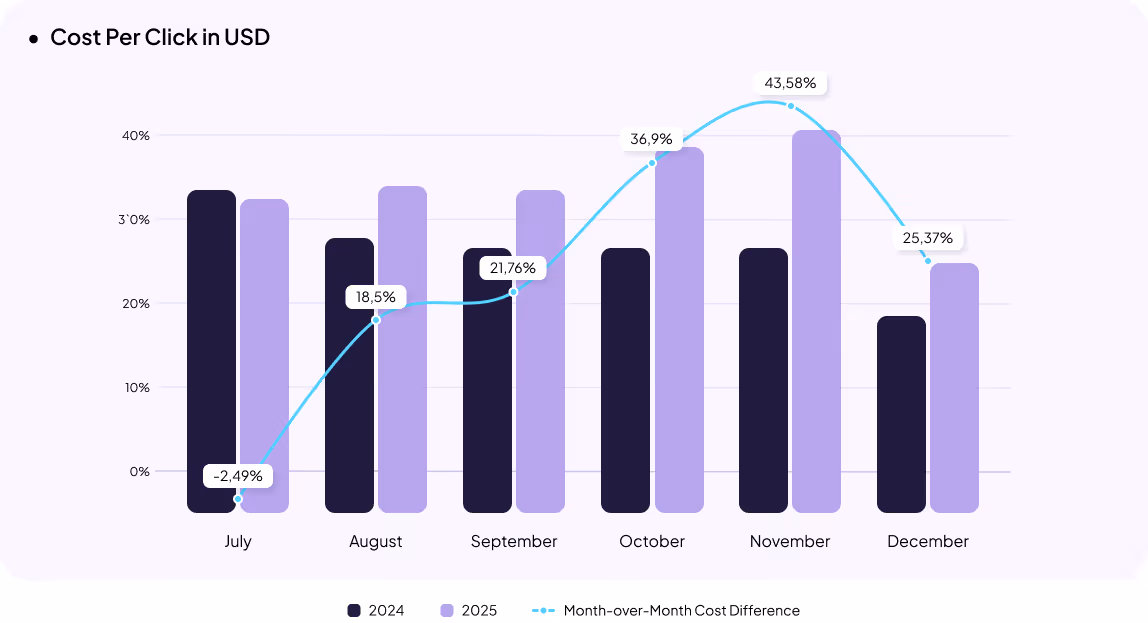
Advertising budgets increased by 11% in USD. However, starting in October, growth rates began to decline, reaching minimal levels in December due to a sharp increase in cost per click (+21%). This was caused by an overheated auction, a budget shift toward Shopping campaigns (+4%), and a corresponding decrease in the share of Search campaigns.
The Pet Supplies category continues to grow благодаря higher purchase frequency and loyal customers, despite declining traffic and rising acquisition costs.
[[SLIDER-START]]
[[SLIDER-END]]
In the fashion and apparel category, revenue declined slightly in the second half of the year — by 1% in UAH and 2% in USD. This indicates a lack of real category growth and restrained consumer demand. The sharpest decline was recorded in Q4, with revenue down 8% in USD.
Hypothesis: revenue dynamics reflect shifting consumer priorities — shoppers are saving more and purchasing clothing and footwear mainly out of necessity rather than impulse.
Traffic volume increased by 23% half-year over half-year, with the highest growth in October (+26%). In recent years, market players have been systematically investing in brand awareness. Brands are focusing on social media promotion and digital media visibility. This is подтверждено by growth in paid social (+70%) and display advertising (+180%). Ahead of the New Year period, traffic from organic social media also increased.
However, the number of purchases grew by only 1% half-year to half-year. The highest growth was recorded in July (+23%), while December showed the steepest decline (-13%), which is atypical for the category and further confirms a shift in seasonal patterns.
The average order value decreased by 2% in UAH and 3% in USD. The largest drops were recorded in November (-10%) and July (-7%) in USD. This suggests that purchase growth was driven by higher order frequency rather than larger basket sizes.
The conversion rate declined by 18% half-year to half-year. Despite increased traffic, it converted into fewer purchases less effectively. This may be linked to changing consumer priorities: Ukrainians now place greater emphasis on quality and durability (39%) and less on prestige (11%), according to a Gradus study.
Advertising budgets increased by 17% in USD. As in 2024, the highest spending occurred during the Black Friday period, when budgets rose by 18%.
Cost per click increased by 16%, likely due to intensified competition in the niche, consistent with trends observed in the first half of 2025.
Within the paid traffic structure, Performance Max remained stable, the share of Shopping campaigns increased, while Search campaigns declined (-4%).
An abnormal increase in direct traffic from non-typical countries was recorded. This traffic did not impact conversion rates and may be related to price scraping or spam activity. It was excluded from the analysis to avoid distorting the actual category dynamics.
[[SLIDER-START]]
[[SLIDER-END]]
In the second half of 2025, revenue in the pharmacy category in the healthcare industry increased by 10% in UAH and 8% in USD. The strongest growth was recorded from July to September — on average +13% in UAH and +12% in USD. In November, growth rates slowed significantly, with an increase of only 2%.
The slowdown may be linked to tighter regulatory pressure, including the introduction of mandatory price declarations for medicines and restrictions on their advertising. An additional challenge for the niche was missile attacks on pharmaceutical warehouses worth billions of hryvnias, leading to reduced inventory levels and supply disruptions.
The number of purchases increased by 8%. The average order value in the second half of 2025 compared to the same period in 2024 rose by 4% in UAH and 3% in USD.
The category is growing mainly due to higher purchase frequency rather than new traffic acquisition or significant growth in average order value. The conversion rate increased by 9%, driven by a 1% decrease in traffic alongside an 8% increase in purchases. This indicates improved traffic quality and stronger purchase intent.
Revenue growth is primarily fueled by existing users who are ordering online more frequently. Ukrainians consider health and medical services (70%) the most important spending category and one where they are least likely to cut expenses.
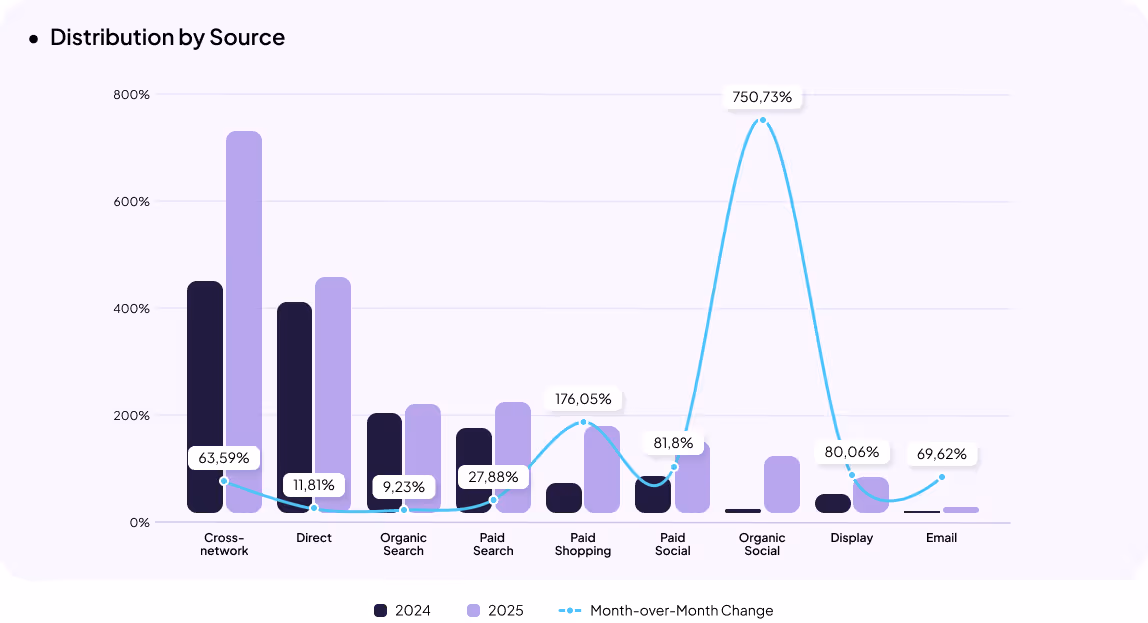
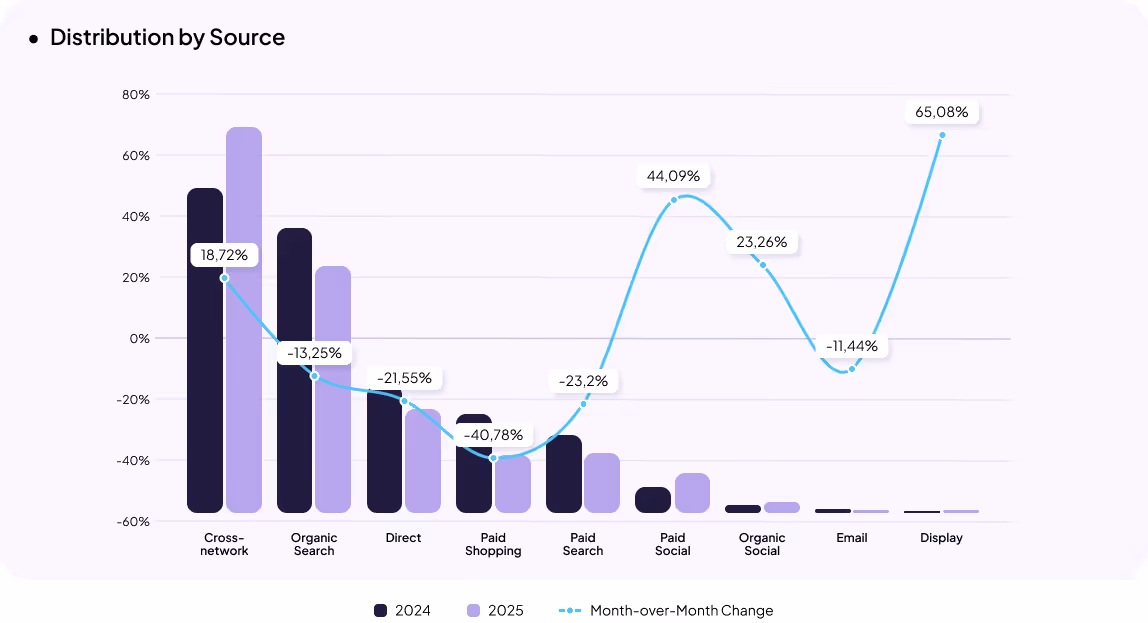
Overall traffic declined. Decreases were observed in display and most organic channels, except for organic social. At the same time, paid search grew significantly (+61%), along with paid social, indicating a strategic shift toward performance-driven channels.
[[SLIDER-START]]
[[SLIDER-END]]
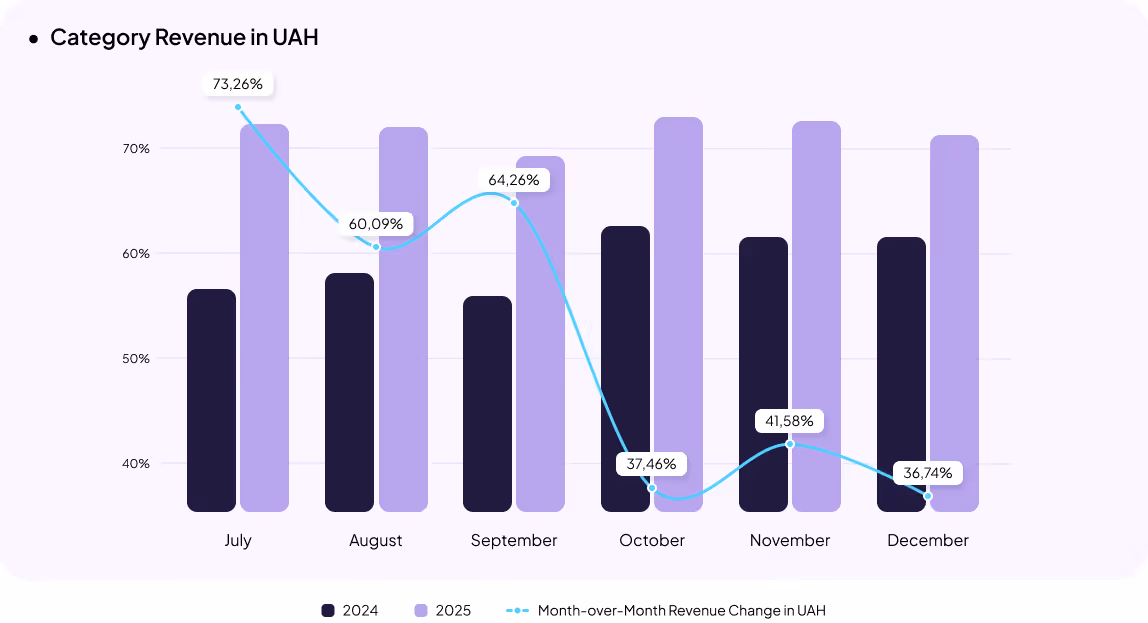
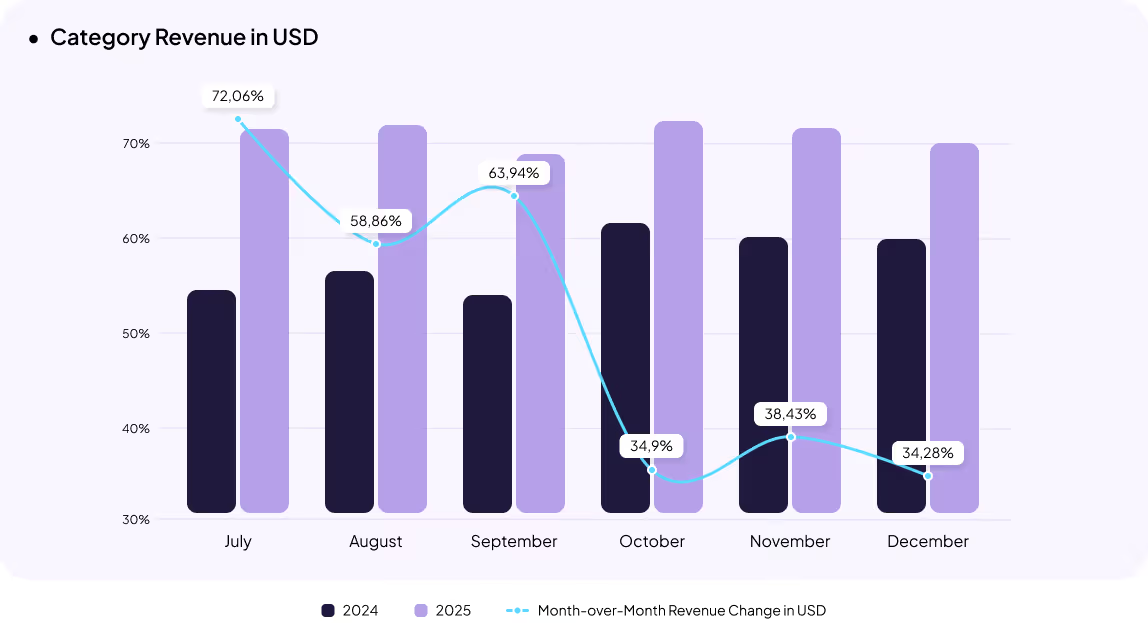
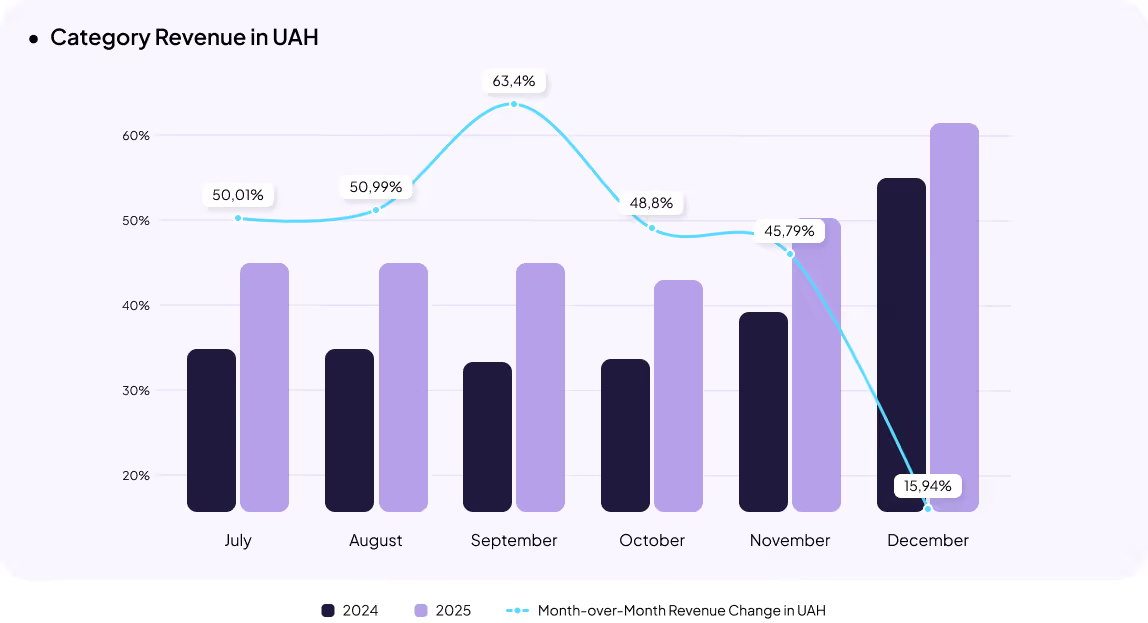
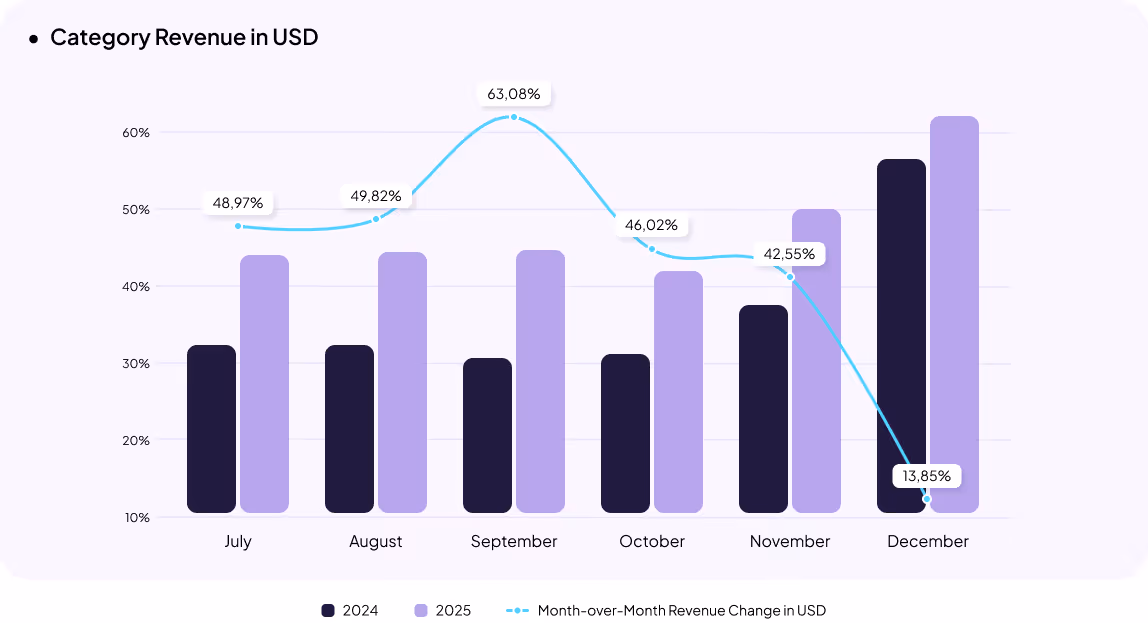
For the third consecutive year, the Jewelry category has demonstrated steady growth. Revenue increased by 40% in USD and 41% in UAH compared to the same period in 2024.
September was the peak month, with revenue rising by 63%. During the same period, advertising budgets increased by 68% half-year over half-year, correlating with revenue dynamics and indicating active brand preparation for the high season.
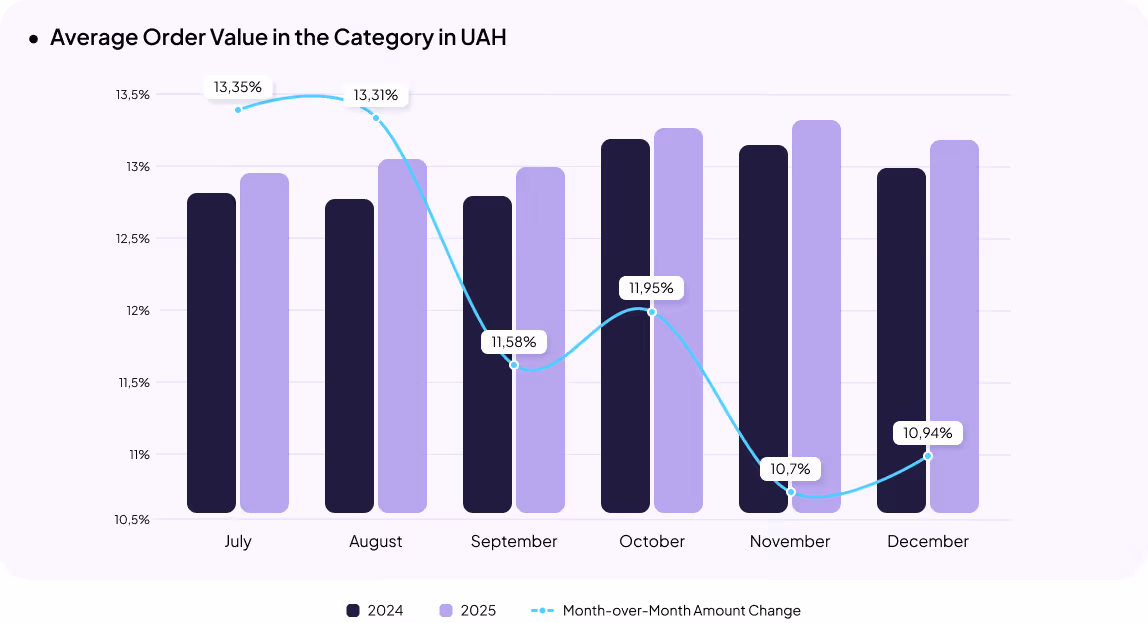
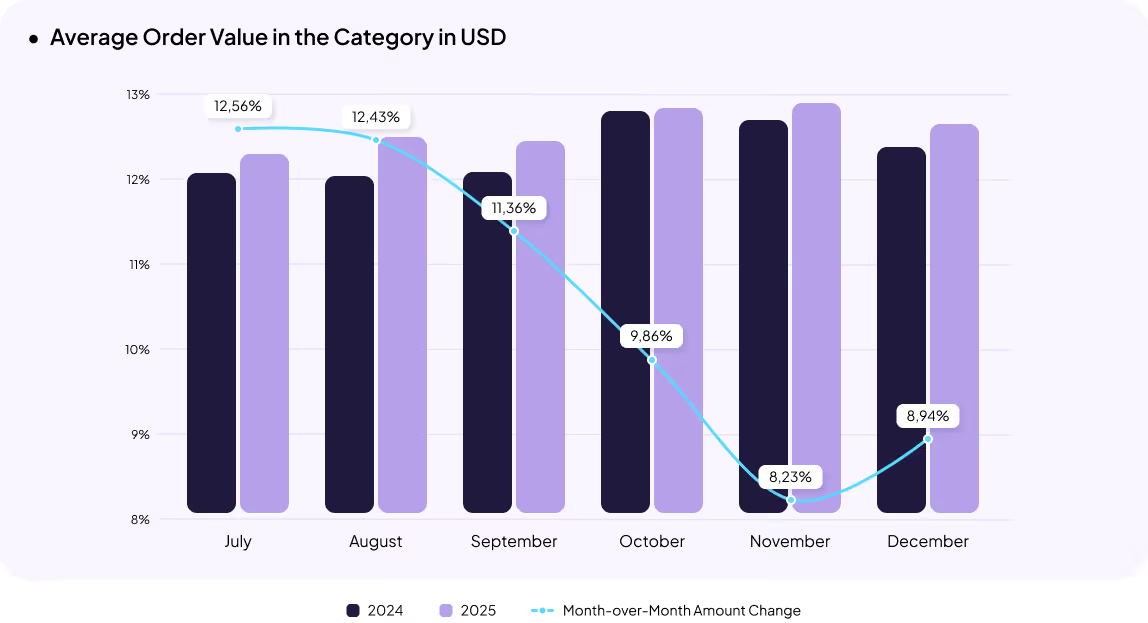
The number of purchases in the second half of the year grew by 16%, although the growth rate was more moderate than in the first half.
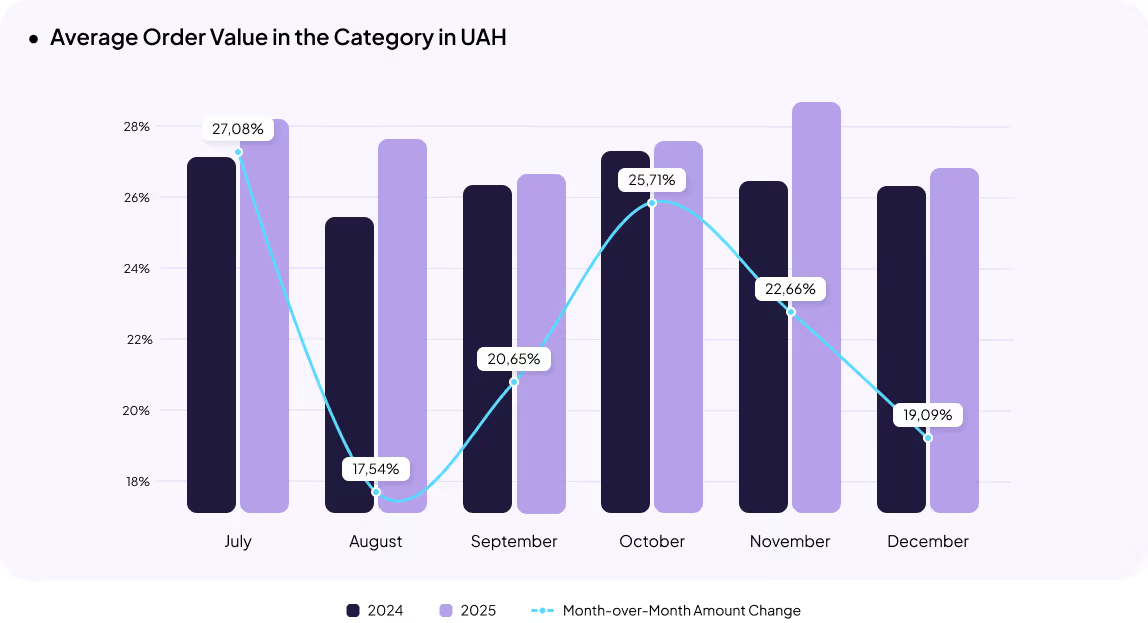
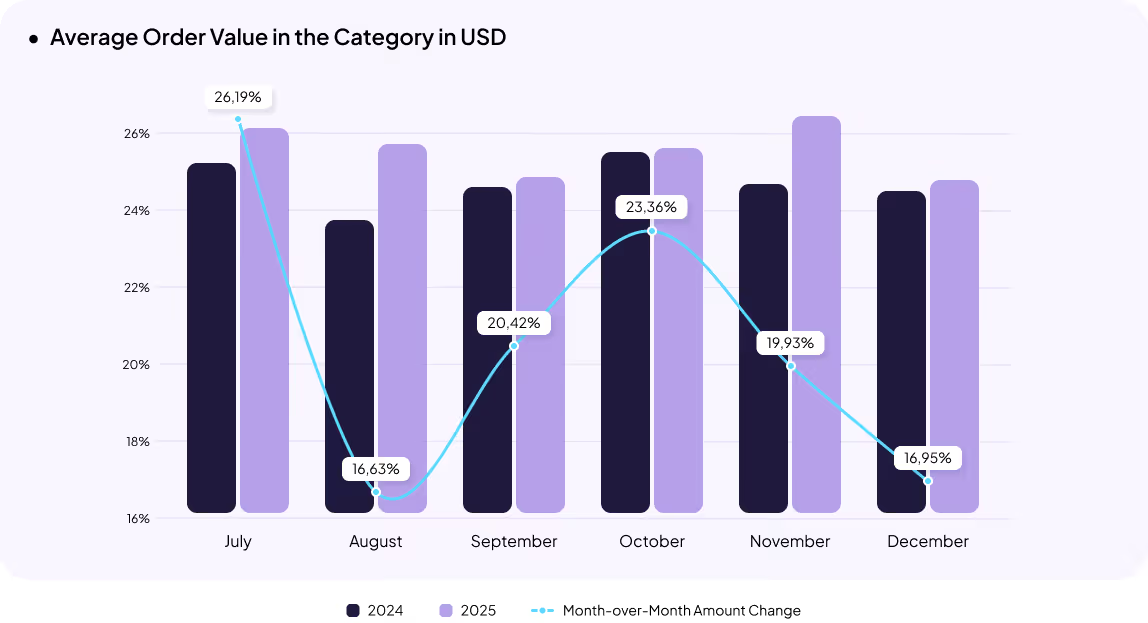
At the same time, the average order value increased by 22% in UAH and 21% in USD, becoming the key driver of revenue growth. This means the category expanded primarily due to higher basket value, with revenue growth largely driven by rising jewelry prices.
The conversion rate remained stable, while traffic volume increased by 16%. The main contributors to traffic growth were paid social, organic social, and display advertising. This confirms the role of social and media channels as key demand drivers in the category.
Advertising budgets in the niche grew by 33% in USD compared to the same period in 2024.
In the second half of 2025, cost per click stopped growing rapidly but still increased by 22% in USD overall. This may indicate shifts in the competitive landscape and a growing number of active players in the niche.
Meanwhile, the share of Search campaigns within the paid traffic structure increased, pointing to stronger formed demand. Ahead of the New Year period, interest in the category intensified as users began actively preparing for the holidays.
[[SLIDER-START]]
[[SLIDER-END]]
The automotive products category continues its gradual growth: in the second half of 2025, revenue increased by 17% in UAH and 15% in USD.
The number of purchases grew by 7%, exceeding the growth rate of the first half of the year. The average order value also increased by 7% in USD, indicating that users were buying more frequently and spending more per order.
Despite a 5% decline in traffic, the conversion rate rose by 13%. This suggests improved traffic quality and stronger purchase intent.
Hypothesis: one of the growth drivers in the second half of 2025 may have been the expiration of tax benefits on electric vehicle imports, which triggered a sharp increase in EV sales toward the end of the year. As a result, demand for related products — winter tires, components, and service items — increased, positively impacting both revenue and average order value in the automotive category.
Advertising budgets rose by 61% in USD half-year over half-year, with peak spending occurring in October–November. During this period, the average order value increased by 7% in USD.
Observations:
In 2025, the seasonal peak in the category started later than in 2024. At the same time, December saw increased demand for car batteries, likely because consumers chose them as a more affordable alternative to charging stations.
Within the campaign structure, budget allocation shifted: the share of Performance Max increased by 7%, while Shopping and Search campaigns declined by more than half. This may indicate a change in paid traffic scaling strategies and the growing role of automated formats.
Overall, the category grew due to improved traffic efficiency and higher average order value, despite a decline in total visits.
[[SLIDER-START]]
[[SLIDER-END]]
Ukrainian eCommerce continued to grow, adapting to challenging economic conditions and evolving consumer behavior. This is reflected in positive revenue and purchase volume dynamics across most categories compared to the second half of 2024.
With overall traffic increasing in many niches, conversion rates also improved, indicating more effective user engagement and better alignment of offerings with customer expectations.
In the second half of 2025, we observed shifts in consumer behavior: buyers made smaller, more frequent purchases, while higher-value items were chosen more deliberately. Accordingly, revenue growth in most categories was driven either by average order value or purchase frequency, depending on the niche.
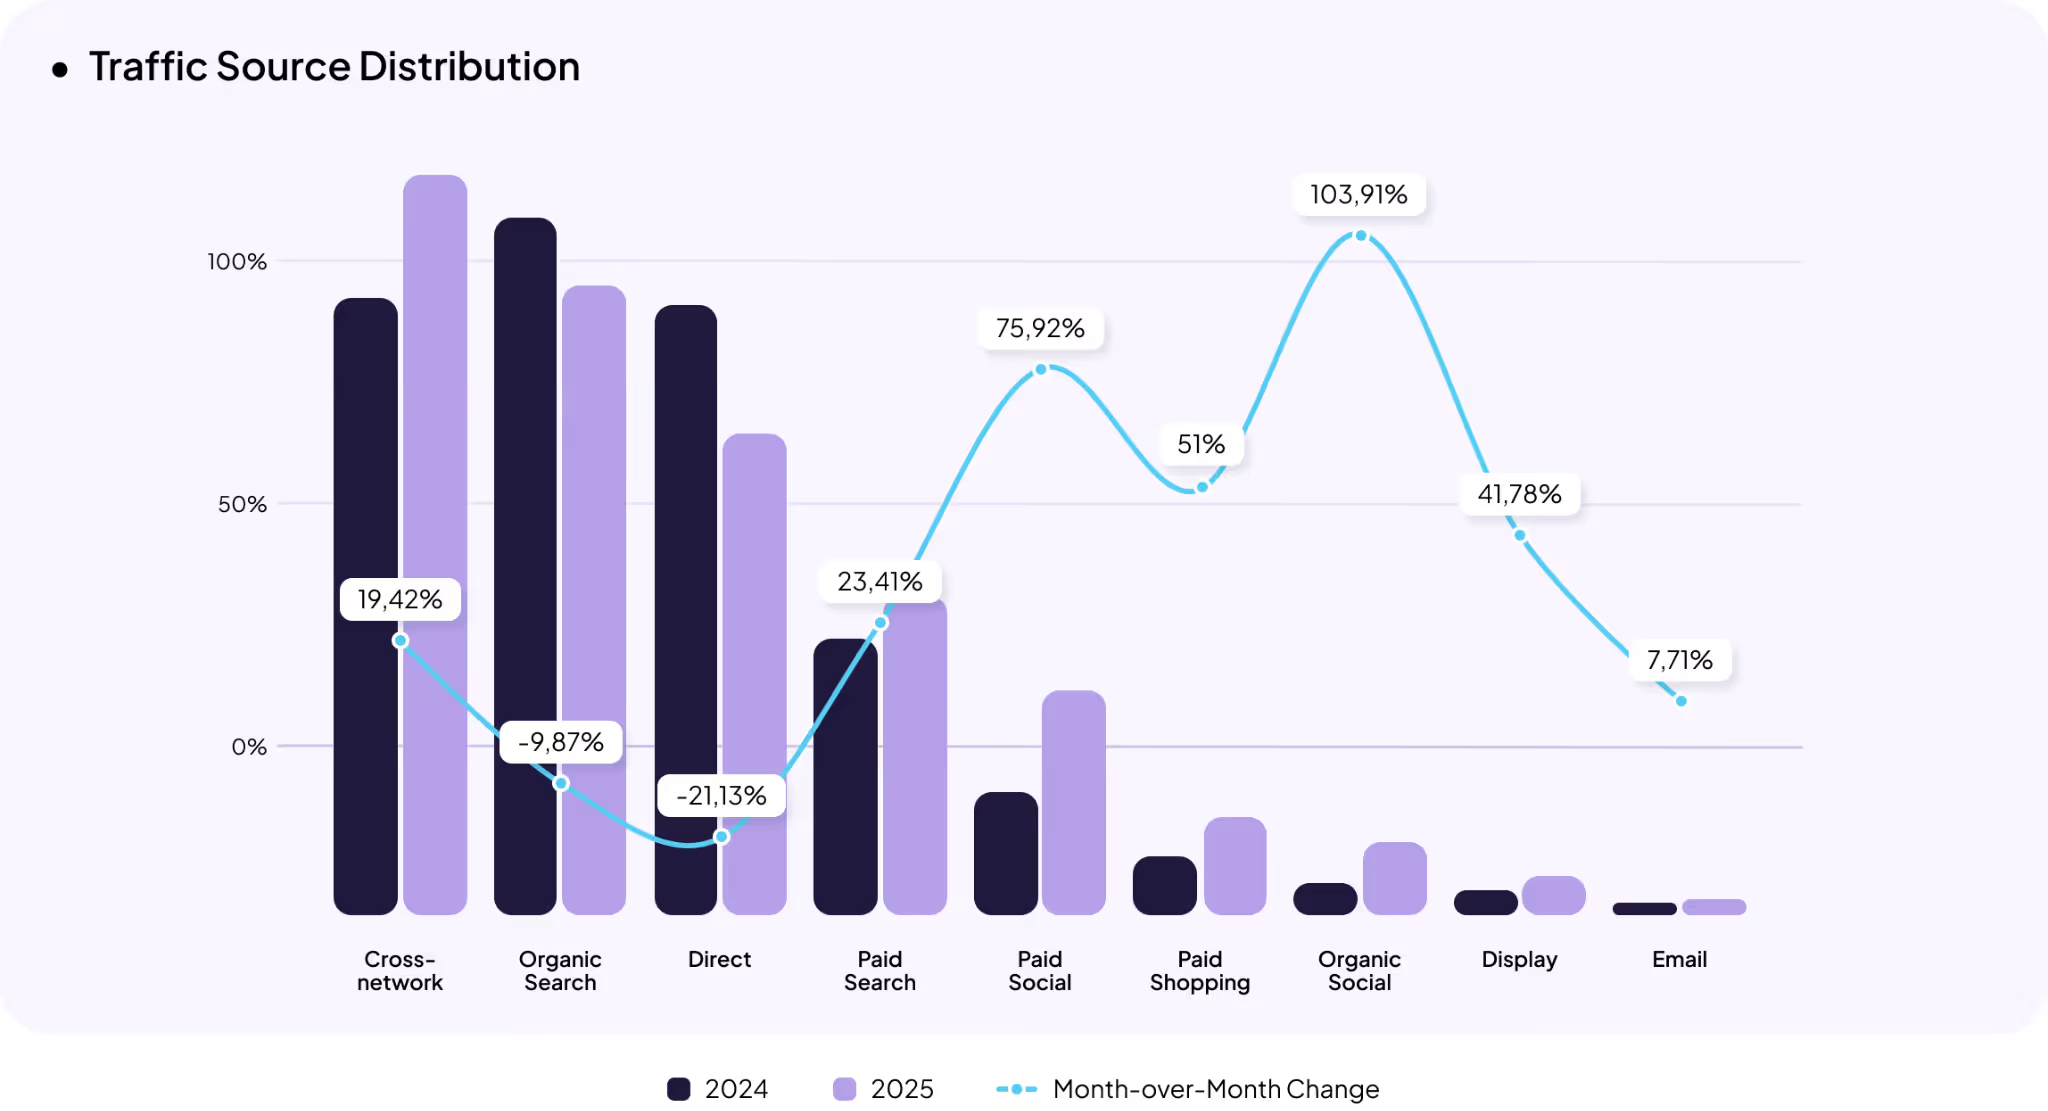
There is a clear trend toward growth in traffic from paid channels, while organic channels showed mixed performance. Paid Search and Shopping campaigns remained key traffic drivers, with advertising continuing to play a central role in both traffic acquisition and revenue generation.
Organic traffic declined in some areas, partly influenced by Google updates (Core Updates, Spam Update), which affected ranking, page visibility, and perceived quality in search results.
Another notable trend is the increase in traffic from social channels. Paid social continues to scale, reflecting greater advertising investment in social networks. At the same time, organic social traffic doubled from half-year to half-year, highlighting the growing value of social media as a channel for audience engagement. According to Gradus research, brand social networks motivate 24% of respondents to make a purchase.
Online retailers are also expanding their mobile app presence. Not only have new apps from major Ukrainian players entered the market, but their role in generating traffic and orders is increasing. This points to a continued investment trend in mobile solutions and additional services — such as subscription delivery and loyalty programs — to enhance customer loyalty and scale new audience acquisition.

Marketing Specialist at Promodo
I have been working in marketing since 2012 with an emphasis on market research and analytics. I am experienced in the following niches: food wholesale, insurance, real estate, and software distribution. I have been responsible for Promodo's cases since 2021. Doing marketing research, I focus on causes and effects, as well as measurable results.
You may also like
Choose quality and trusted services to improve the presence of your company on the Internet, and feel free to contact our UK team if you have any questions.

80% of users are more likely to make a purchase when brands offer customers a personalized experience and well-designed offers.

Promoting pharmaceutical websites is quite challenging because they are in the YMYL* (Your Money or Your Life) category, closely related to health and life.

Both platforms offer wide functionality. However, when it comes to SEO results, which one scores the most?
We at Promodo are ready to help you improve your performance across all digital marketing channels.
Get started