


Content



Team Lead of Content for promodo.com
Experienced in working with data, expert recommendations, and real business cases to create clear and valuable content that delivers real business impact. Passionate about discovering new insights, exploring industry trends, and turning complex topics into practical, easy-to-understand content.

SEO Specialist at Promodo
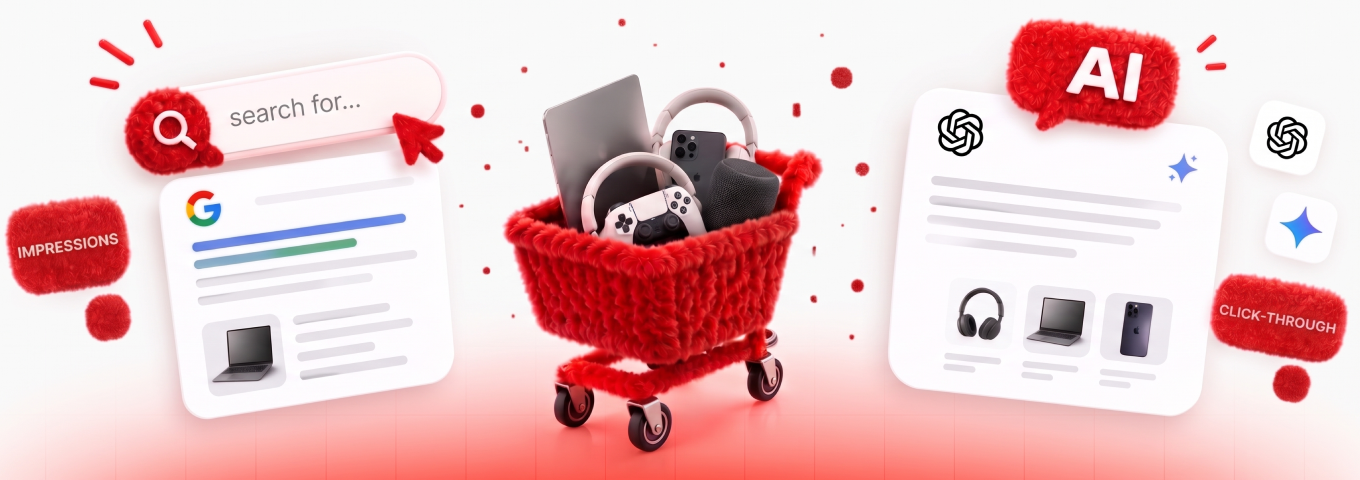
Only some product categories have seen a major shift toward Google’s AI Overviews, and consumer electronics shows the differences clearly. We analyzed Ahrefs keyword data for five major device categories — smartphones, smartwatches, headphones, TVs, and laptops — and looked at the U.S. queries that currently trigger an AI Overview.
The gap is striking. TV searches generate 179,356 AI Overview keywords, compared with just 1,920 for smartphones — a 93x difference. But keyword volume alone doesn't tell us where AI Overviews matter most for brands. Once we narrowed the data down to queries with clear purchase intent, the picture changed significantly.
TV has 93 times more AI Overview keywords than smartphones (179,356 vs. 1,920), but the highest AI Overview exposure doesn't necessarily mean the strongest buying intent.
This gap is not just about market size. Smartphones and smartwatches are massive product categories, yet they generate the fewest AI-Overview-triggering searches of the five. That tells us AI Overviews haven't saturated every corner of consumer electronics search equally; they cluster hardest around comparison-heavy, "which one should I buy" categories.
For brands, this means AI Overview visibility strategy can't be copy-pasted across product lines. Each category needs its own diagnosis of how much AI is already sitting between the shopper and the SERP.
.webp)
TV produced by far the largest AI Overview footprint in the dataset. But look at what's actually driving that volume:
The top five AI Overview keywords for "TV" are: roku tv (239K), youtube tv cost (166K), apple tv shows (165K), cbs tv schedule tonight (154K), and abc tv schedule tonight (139K) — every one of them branded, and none of them about choosing which television to buy.

These are streaming-service and programming queries, not appliance-purchase queries. Google's AI Overviews are answering "what's on TV tonight" and "how much does YouTube TV cost," not "which TV should I buy." The CPC on several of these terms is under $0.25, which is a strong signal of low commercial (buy-now) intent.
This is a critical distinction for TV manufacturers and retailers: a huge AI Overview footprint in your category doesn't automatically mean AI is reshaping your product discovery funnel. Content and service queries can inflate category-level numbers while leaving the actual purchase journey largely untouched by AI Overviews.
Laptop is the only category among the five where nearly every high-volume AI Overview keyword is a direct buying query:
Four of the top five AI Overview keywords for "laptop" — best gaming laptop (164K), best laptop (131K), best laptop 2026 (125K), and cheap laptop (73K) — are explicit purchase-comparison searches, all carrying commercial "C" intent tags.

This is why laptops rank 1st–2nd once we adjust for intent quality rather than raw keyword volume: the demand is not diluted by branded service or content searches the way TV is. Every one of these top keywords also carries a $0.25–$0.45 CPC, confirming genuine commercial value.
For laptop retailers, this is the category where winning the AI Overview, not just the organic snippet below it, has the most direct line to revenue.
Across every single category we studied, one keyword pattern shows up at or near the top of the AI Overview list: the comparison query.
[[SLIDER-START]]


[[SLIDER-END]]
This pattern held regardless of category size, whether the category generated 1,965 AI Overview keywords or 179,356, "best" and comparison-style queries consistently appeared as top AI Overview triggers.
For consumer electronics brands, the most valuable content format across categories is structured comparison content — buying guides, “best of” lists, and spec-based comparisons. These are the types of queries Google is increasingly summarizing with AI.
One of the more counterintuitive signals in the data: Clicks Per Search (CPS) — Ahrefs' metric for average clicks generated per search — stays above 1.0 on nearly every high-volume "best X" query, even though these are exactly the queries most likely to surface an AI Overview.
"Best noise cancelling headphones" carries a CPS of 1.33, "best gaming laptop" a CPS of 1.23, and "best android smartwatch" a CPS of 1.19 — all higher than the CPS on purely informational queries like "what is a smartwatch" (0.79) or "homework smartphone" (N/A, too low to register).
In other words, users aren't stopping at the AI-generated summary for comparison-heavy purchase queries, they're still clicking through to multiple sources to validate the answer. That's a meaningfully different behavior pattern than the "zero-click" narrative often applied to AI Overviews broadly.
For marketers, this is reassuring: high-intent, comparison-driven electronics queries still reward strong on-page content with real click-through traffic, even inside AI Overview SERPs.
AI disruption is not the same across all product categories. For example, a brand selling both TVs and laptops may need different approaches. TV content may benefit more from branded and service-related queries, while laptop content should focus on comparison queries with stronger purchase intent.
To understand where your brand appears in AI search, you can also check its visibility with Gelios, Promodo’s AI visibility tool. It helps track how often and where a brand is mentioned across AI-generated answers.
“Best laptop” or “Best smartphone” queries consistently trigger AI Overviews across the categories we studied. This makes structured comparison content a strong format to prioritize. Include clear specs, pros and cons, and straightforward recommendations that search engines and AI systems can easily understand and use.
The TV category shows why overall AI Overview keyword volume can be misleading. Of the 179,356 keywords analyzed, many were branded or service-related rather than purchase-focused. Separate commercial (C) and informational (I) keywords before evaluating AI search opportunities.
AI Overviews have not removed the value of organic rankings for high-intent electronics queries. CPS above 1.0 for comparison queries shows that users still click through to relevant results. Well-structured buying guides can therefore drive both AI visibility and organic traffic.
Use clear headings, direct answers, comparison tables, and concise verdicts in buying guides and comparison pages. These formats make content easier for Google AI Overviews and AI assistants such as ChatGPT, Perplexity, and Gemini to understand, extract, and cite.
This approach has already delivered results for a consumer electronics and power-tools manufacturer.
The problem: The product pages already contained detailed specs, manuals, videos, and reviews. However, this content was split across separate ?tab= URLs, making it harder for search engines and AI systems to understand the product page as a single source. AI traffic had also remained flat throughout 2025.
What we changed:
Results after 3 months (February–May 2026):
Compared with January 2025, AI traffic grew by more than 3,200%. At the same time, product pages became the landing page for most AI-driven visits, suggesting that AI assistants increasingly used them as sources for product information.
The growth came from making existing product content easier for bots to access and understand.
.webp)
[[FAQ-START]]
Most searches aren't for "smartphone" as a category — they're value-driven. Comparison and use-case queries like "smartphone startup" and "holiday smartphone" outperform the generic term, and "foldable smartphone" alone pulls 34K global search volume, showing format innovation drives real interest.
No — it's the smallest AI Overview footprint of all five categories studied, at just 1,920 keywords. AI Overviews haven't saturated this category the way they have TVs or laptops.
Comparison-first: "best smartwatch" (14K) and "best android smartwatch" (7.5K) dominate, alongside "what is a smartwatch" (9.2K), which signals a real education gap still exists even in a mature product category.
Barely, so far — smartwatch has the lowest AI Overview keyword count of all five categories (1,965), meaning most smartwatch search still plays out in traditional organic results rather than AI summaries.
Almost entirely through comparison and "best of" queries: "best headphones" (180K), "best noise cancelling headphones" (72K), and "best wireless headphones" (34K) make up the bulk of demand.
Feature. Nearly every top query centers on a specific capability (noise cancelling, wireless, over-ear) rather than a brand name, showing buyers filter by use case before brand loyalty kicks in.
Mostly not to buy one. Top queries — "roku tv" (239K), "youtube tv cost" (166K), "apple tv shows" (165K), "cbs tv schedule tonight" (154K) — are about streaming services and programming, not appliance shopping.
No. TV has the largest AI Overview keyword footprint of any category (179,356) but the weakest connection to actual TV-buying intent — branded and content queries inflate the numbers.
Directly and commercially: "best gaming laptop" (164K), "best laptop" (131K), "best laptop 2026" (125K), and "cheap laptop" (73K) all carry explicit purchase intent and $0.25–$0.45 CPCs.
[[FAQ-END]]
Team Lead of Content for promodo.com
Experienced in working with data, expert recommendations, and real business cases to create clear and valuable content that delivers real business impact. Passionate about discovering new insights, exploring industry trends, and turning complex topics into practical, easy-to-understand content.
SEO Specialist at Promodo
You may also like
Choose quality and trusted services to improve the presence of your company on the Internet, and feel free to contact our UK team if you have any questions.

Whether you’re a personal injury attorney, divorce lawyer, or criminal defense specialist, running the proper PPC marketing for lawyers will grow your practice.

Recommerce retail is a developing trend, and there are good reasons for this.

Web push notifications in eCommerce and retail have the lowest engagement rate among all other niches.
We at Promodo are ready to help you improve your performance across all digital marketing channels.
Get started



.svg)


