Content


Copywriter at Promodo
Over nearly three years as a copywriter, I’ve written for US and European startups and companies, including SE Ranking. I enjoy working with words—finding the right phrasing, organizing ideas, and turning them into clear and useful content that shows real value and helps businesses grow.
.avif)
If you’re here, you’re probably trying to understand whether your conversion rate is actually good for your industry and channels or if you’re losing potential revenue.
The challenge is that most benchmarks are too broad to be truly useful. Conversion rates depend on your niche, traffic source, device mix, customer type, and even the regions you sell in.
We gathered eCommerce conversion rate benchmarks across different channels, industries, devices, and audience segments to help you evaluate your performance more realistically and spot where optimization can drive growth.

Source: Dynamic Yield
Knowing the benchmark is useful, but understanding what's influencing your conversion rate is what helps you improve it.
In eCommerce, conversion growth usually comes from fixing friction in the buying journey: product discovery, mobile UX, product page clarity, trust signals, or checkout flow. Small issues in these areas can reduce revenue even when traffic is strong.
At Promodo, we help eCommerce brands identify where users drop off and optimize the experience around the points that most impact sales.
.webp)
According to the latest Promodo data on email marketing benchmarks, the average conversion rate for promo email campaigns across industries is 1%. For trigger emails, the average conversion rate is around 2%.
More detailed breakdown of email conversion rates for categories like electronics, auto parts, or tires, you can find in our full guide:

Organic traffic is more context-dependent, so universal conversion rate benchmarks are less useful. Performance varies by search intent, page type, and traffic segment. A blog post will convert differently from a product page. The most practical approach is to benchmark each segment separately and use your top-performing pages as the reference point.
Here’s what other sources provide for different channels (organic search, paid search, email, direct etc):
Source: Convertibles
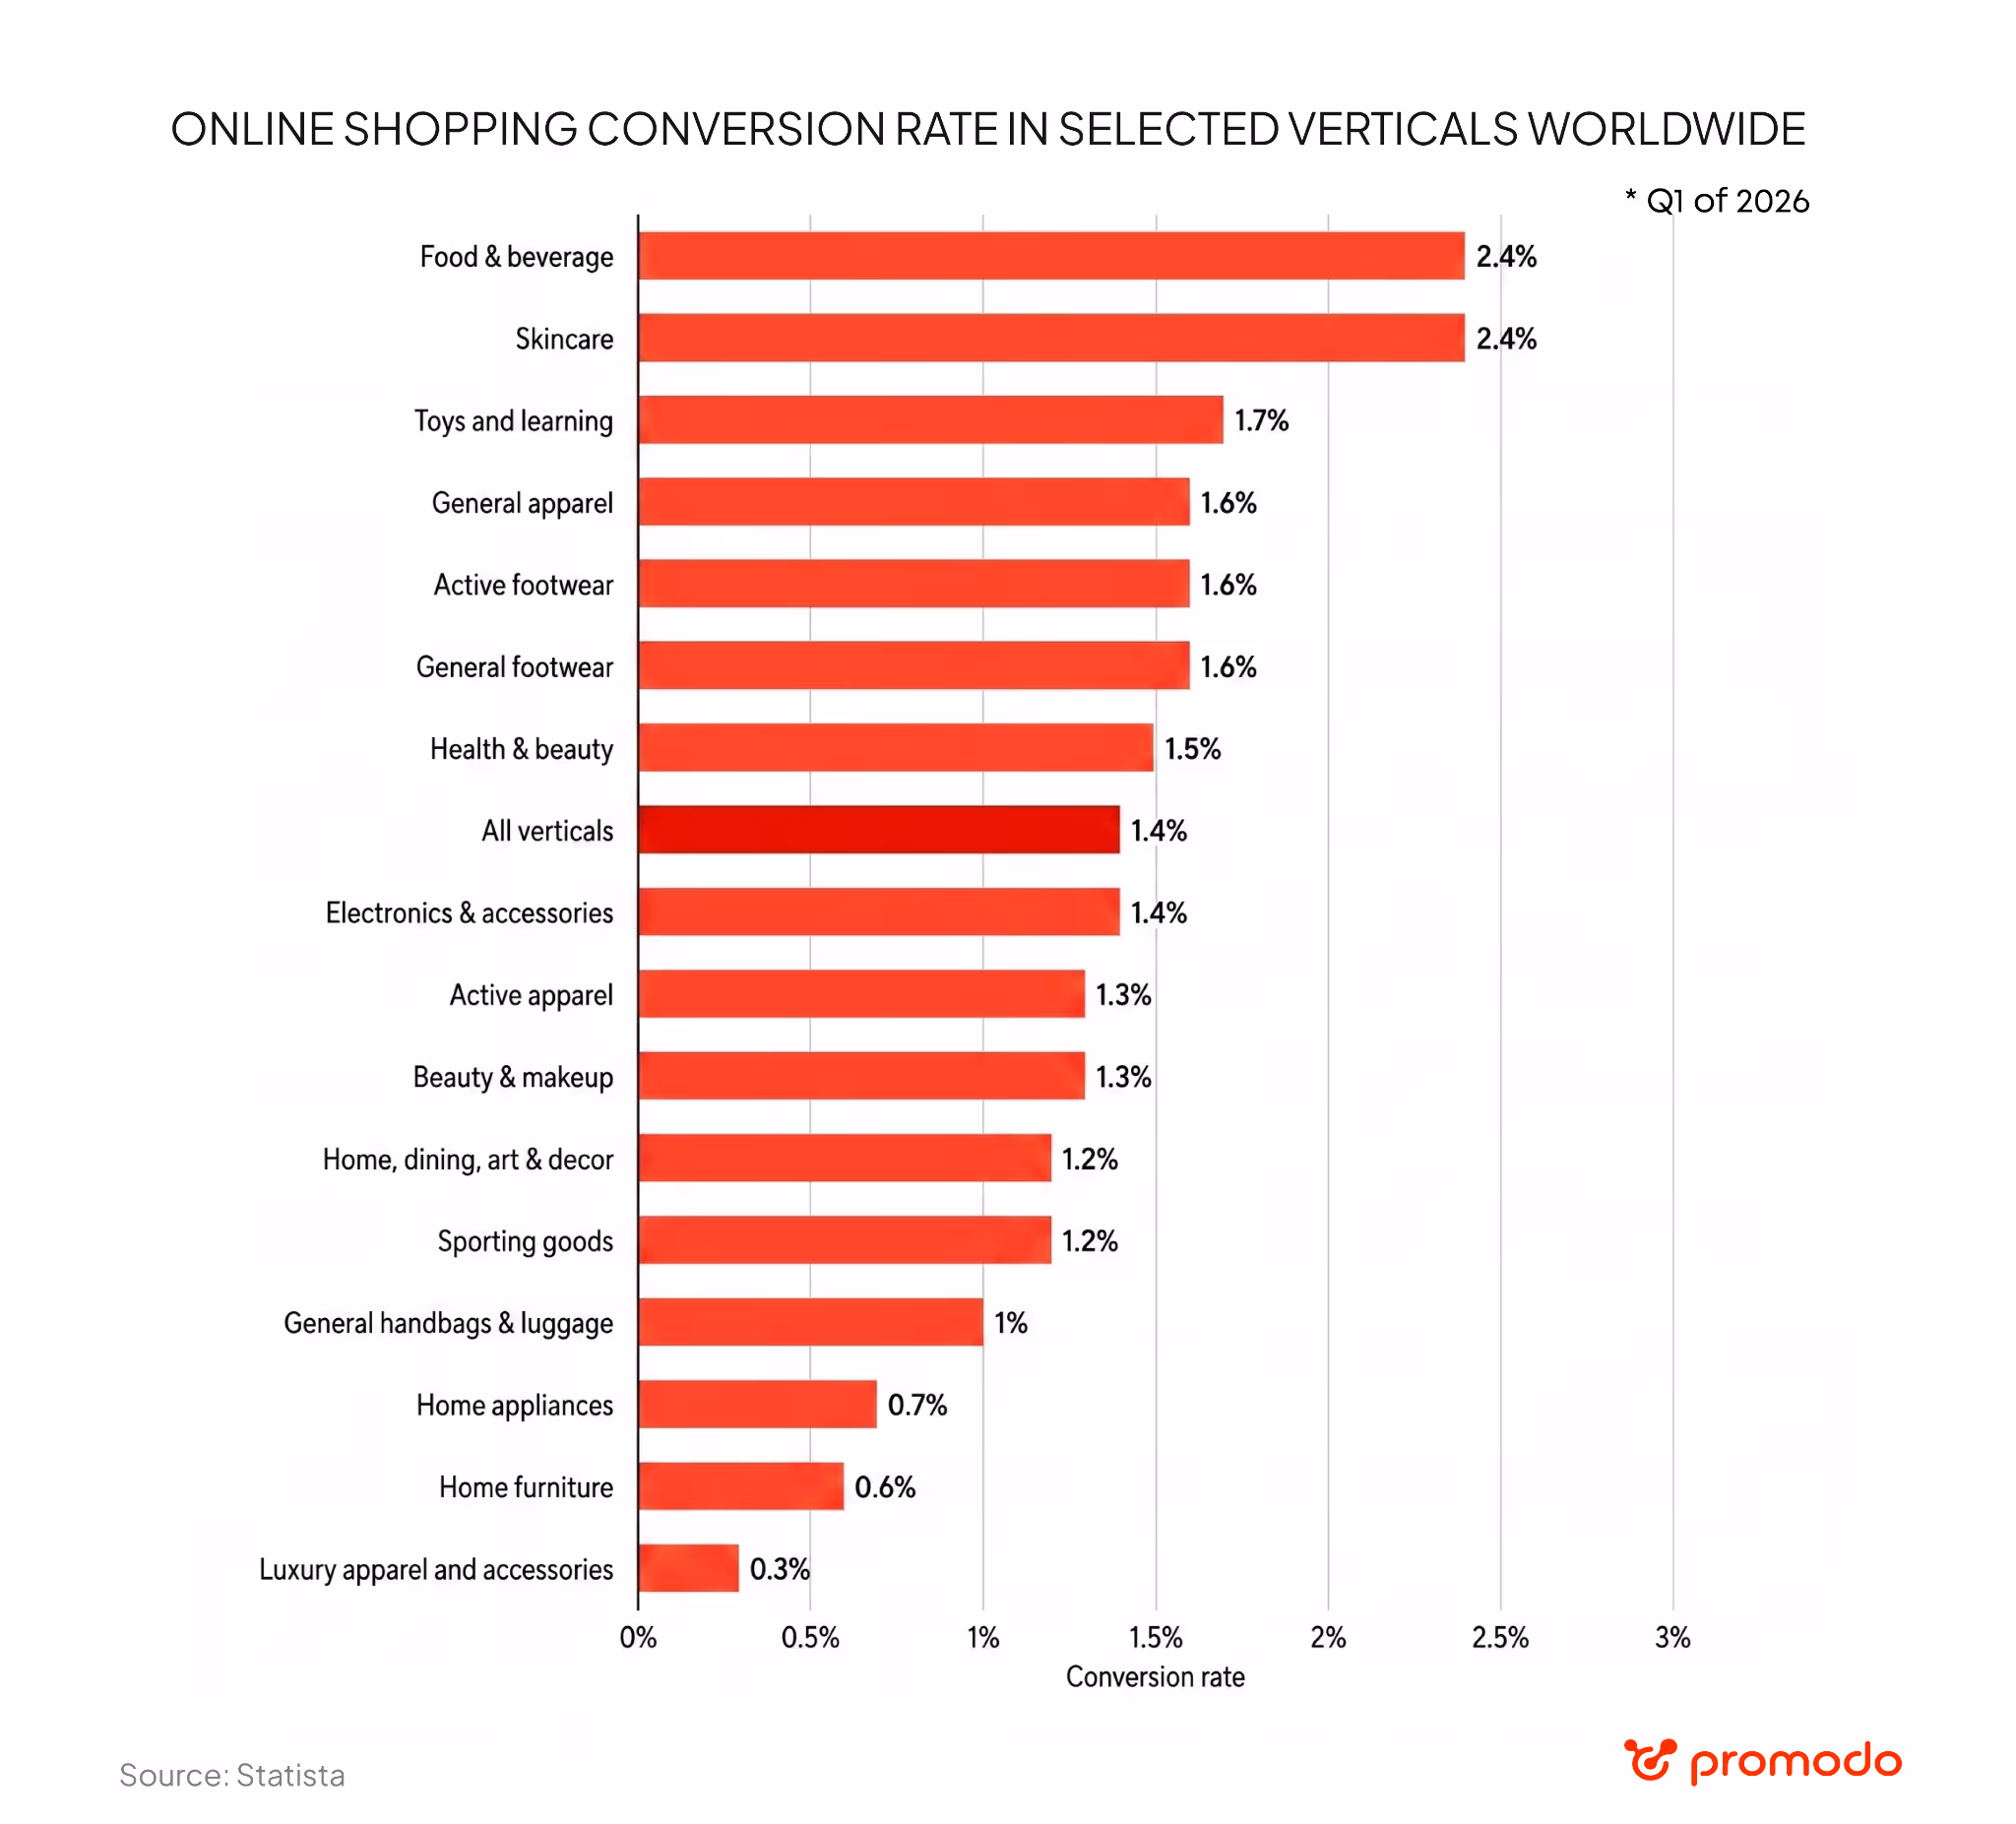
Statista published the latest update on the online shopping conversion rate worldwide in the 1st quarter of 2026. We see different verticals, but the highest percentage is in the food and beverage and skincare niche.
The average conversion rate based on all verticals is 1.4%.
Dynamic Yield tracks conversion trends across niches, and their general recommendations look like this:
One more category: consumer electronics — the average CVR for it is around 1.6%.
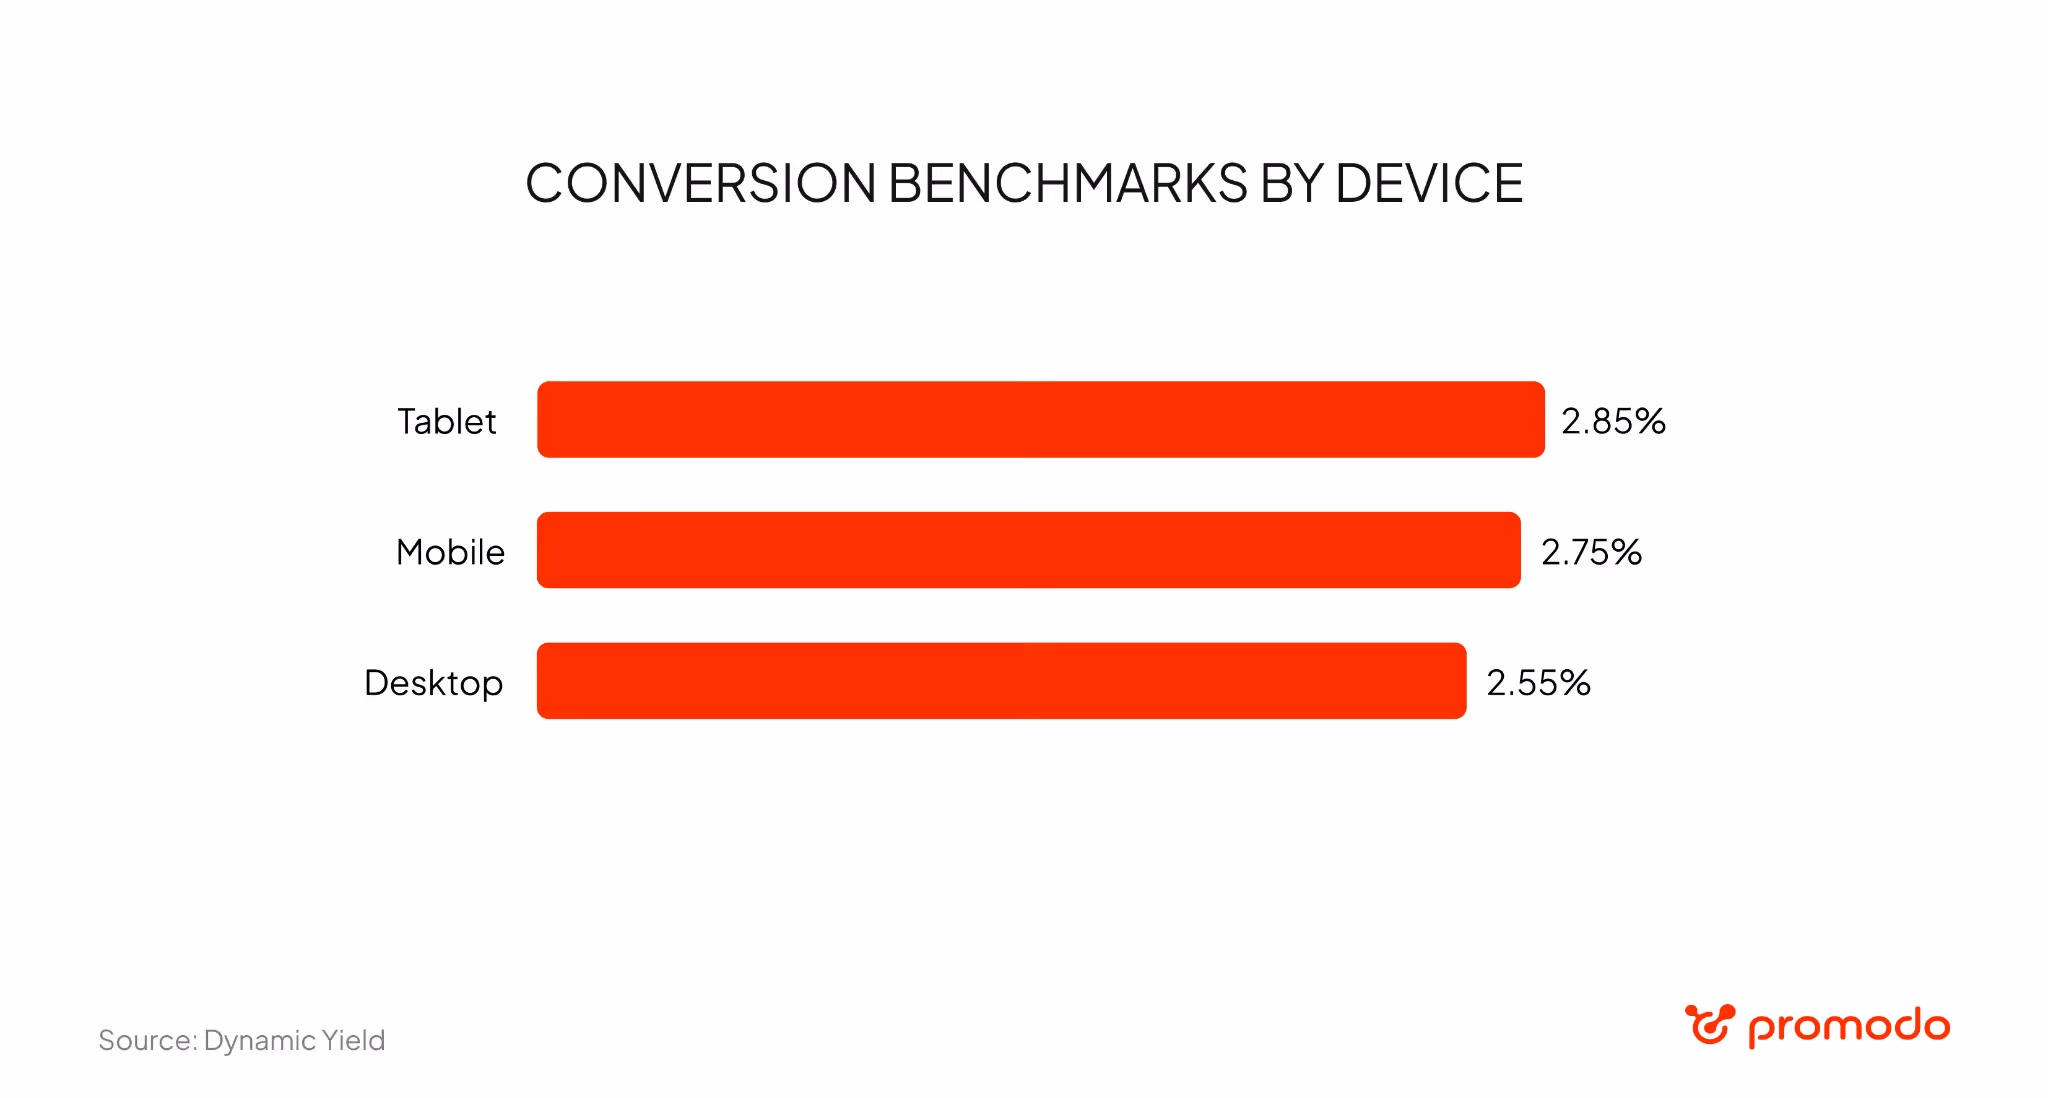
According to Dynamic Yield, tablets show the highest average conversion rate at 2.85%, slightly ahead of mobile (2.75%) and desktop (2.55%).
The mobile conversion rate ranged from 2.4% to 3.2% over the last 12 months. Desktop organic CVR ranged from 1.7% to 3.3%, but conversion rates have been gradually decreasing this year. Conversion rate on tablets ranges from from 2.4% to 3.4%.
If you are an international brand, regional benchmarks are far more useful than relying on one global average.
In the source we reviewed, North America had the highest average eCommerce conversion rate at 3.5%. Then it is Europe at 3.0% and Asia-Pacific at 2.8%. The gap likely comes down to differences in eCommerce maturity, payment infrastructure, and delivery expectations.
Dynamic Yield reports that the Americas have the highest overall conversion rate (2.88%). EMEA goes next (2.65%), then APAC (1.7%).
According to Convertibles, first-time visitors are 2–3 times less likely to convert than returning customers.
The general picture looks like this:
Asaxiy is a major electronics eCommerce retailer. They came to us after growth in key conversion metrics stalled and performance began lagging behind competitors.
We analyzed the situation and identified the issue: mobile accounted for most of the traffic but also had the highest abandonment rates. Key conversion metrics were below expected benchmarks, including a 4.5% add-to-cart rate and an 82% cart abandonment rate.
To identify the root causes, we combined quantitative and qualitative research: funnel analysis, heatmaps, session recordings, usability testing, user interviews, and a UX audit of 800+ interface elements.
The findings pointed to several friction points in the purchase journey: difficult catalog navigation, inconvenient mobile filters, unclear product page hierarchy, and unnecessary friction during checkout.
Based on these insights, we developed and prioritized 40+ CRO hypotheses, then tested changes with the highest expected impact. We simplified navigation, optimized product pages, and made checkout actions more visible and easier to complete.
The result: a 42% increase in conversions.

Telemart is a large electronics retailer with more than 11,000 products. Their goal was to grow organic revenue and improve visibility in priority categories ahead of the S.T.A.L.K.E.R. 2 release.
Instead of focusing on isolated SEO fixes, we worked on the parts of the site that directly affected discoverability and conversion. First, we cleaned up low-value pages generated by the CMS to improve crawl efficiency and help Google prioritize high-impact categories and filters. Then we reworked category structure and filtering logic based on real search demand, expanded optimized category content, and strengthened the backlink profile for priority sections.
At the same time, UX improvements helped reduce friction in the shopping journey, making it easier for users to find products and move through the purchase flow. As a result, Telemart achieved significant growth in organic performance and increased sales by 30%.
.webp)
The benchmarks in this article can help you understand what conversion rates typically look like across channels, industries, devices, and audiences. But they are rather reference points than targets.
Your actual performance depends on many factors, including your niche, market, pricing, traffic quality, user experience, and customer behavior. Two eCommerce businesses in the same category can have very different conversion rates and still perform well.
But if you feel you're consistently below benchmark or simply believe your site could convert better, our CRO specialists can help identify what's limiting performance and find opportunities to improve conversion rates.

Copywriter at Promodo
Over nearly three years as a copywriter, I’ve written for US and European startups and companies, including SE Ranking. I enjoy working with words—finding the right phrasing, organizing ideas, and turning them into clear and useful content that shows real value and helps businesses grow.
You may also like
Choose quality and trusted services to improve the presence of your company on the Internet, and feel free to contact our UK team if you have any questions.

How the Meta Andromeda algorithm works and why creatives are becoming the central component of advertising.

Investing in text search ads on Google means that whenever someone puts the same keyword in the search feed you’ve bid on, there’s a PPC match.

Close monitoring and analysis of PPC ads with built-in analytics tools will help you understand how effective are your pet clinic advertisements.
We at Promodo are ready to help you improve your performance across all digital marketing channels.
Get started