Content


Team Lead of Content for promodo.com
Experienced in working with data, expert recommendations, and real business cases to create clear and valuable content that delivers real business impact. Passionate about discovering new insights, exploring industry trends, and turning complex topics into practical, easy-to-understand content.
Team Lead PPC at Promodo

Running ads, generating sales, and seeing a positive ROAS in your dashboard is not the same as making money. One of the most persistent mistakes in paid search is measuring campaign performance by revenue or turnover without accounting for the real profitability of the business behind the ads.
The result? Paid ad campaigns that look great in Google Ads while operating at break-even or, worse, at a loss.
In this guide, we'll break down how to correctly evaluate PPC profitability, which metrics actually matter for decision-making, how to work with profitability at the product and category level, and which approaches genuinely move the needle on your advertising ROI.
PPC profitability is the relationship between the real income or profit generated by your campaigns and the money spent to run them. It's not about impressions, clicks, or even conversions in isolation — it's about whether advertising is creating sustainable value for the business.
This distinction matters because revenue and profit are very different numbers, and the gap between them is where most PPC budgets quietly disappear.
Consider margin and LTV as the anchors of any profitability calculation. A campaign generating $50,000 in revenue looks very different depending on whether the product margin is 10% or 45%, and whether those customers return to buy again or churn immediately. Ignoring either variable means your ROAS target is essentially arbitrary.
There's also a structural issue specific to eCommerce that often goes unaddressed: order fulfillment rates.
"Businesses earn not from placed orders, but from those that were actually picked up and paid for. In large eCommerce operations, the fulfillment rate ranges from 40% to 75%, so there can be a significant gap between what the ad platform reports and what the company actually earns. Failing to account for this means even strong ROAS or cost-per-revenue figures can create a false impression of profitability."
— Yevhen Kolotilo, PPC Expert at Promodo
Here's a concrete example of how this plays out:
A business sets a KPI of no more than 10% ad cost share, with a 30% product margin — seemingly leaving a comfortable 20% buffer. But if the fulfillment rate is 50%, ad spend is calculated against the full order value, while revenue is only collected on half of it. The real cost share doubles: 10% becomes 20%. At a 30% margin, only 10% remains — and that's before logistics, rent, and salaries.
This is why profitability must be calculated against actual post-fulfillment, post-return revenue — not gross order value. Without this adjustment, every metric — ROAS, ROMI, ROI — reflects a version of reality that doesn't exist.
There are four core metrics that PPC specialists use to measure profitability: ROAS, ROI, Marketing ROI (ROMI), and cost share (sometimes called DRR or ad cost ratio). Each answers a different question, and none replaces the others.
ROAS measures how much revenue is generated for every unit of currency spent on advertising. It's the most immediate signal of campaign-level efficiency — but it's only a starting point, not the full picture.
ROAS Formula: ROAS = Revenue from ads ÷ Ad spend
Example of ROAS calculation: You spend $10,000 on ads and generate $50,000 in revenue. ROAS = 50,000 ÷ 10,000 = 5x
That sounds strong. But if your product margin is 18%, your break-even ROAS is actually 5.6x. A ROAS of 5 at that margin means you're losing money on every dollar of ad spend.
ROAS is fast and easy to track — Google Ads reports it natively, which makes it the default KPI for day-to-day campaign management. But used in isolation, especially across a mixed-margin product catalog, it produces misleading conclusions.
What is a good ROAS? There's no universal answer. A good ROAS is one that exceeds your break-even ROAS given your actual margin structure. For high-margin products, a 3x ROAS may be excellent. For razor-thin-margin categories, even a 10x ROAS might not be profitable. We cover ROAS benchmarks by industry in our PPC benchmarks guide.
ROI is the broadest profitability metric. It accounts for all costs associated with generating revenue — not just the ad spend, but cost of goods, logistics, operations, and fulfillment.
ROI Formula: ROI = (Revenue − Total costs) ÷ Total costs × 100%
Example of ROI calculation: You generate $80,000 in revenue. Total costs (product, logistics, operations, advertising) come to $60,000. ROI = (80,000 − 60,000) ÷ 60,000 × 100% = 33.3%
In the context of PPC, ROI is rarely tracked at the campaign level — it requires cost-of-goods data that ad platforms don't have access to. But it's essential for strategic decisions: whether to scale a channel, compare paid search against other acquisition methods, or evaluate whether your current business model is viable at a given ad budget.
Average PPC ROI varies widely by industry, margin structure, and business model. Rather than chasing a benchmark, the more actionable number is your break-even ROI — the point at which the business neither gains nor loses — and then measuring campaigns against that.
PPC ROI formula at its simplest: (Revenue from PPC − PPC spend − COGS − operating costs) ÷ (PPC spend + COGS + operating costs) × 100%.
ROMI sits between ROAS and full ROI. It accounts for all marketing costs — not just the ad budget, but agency fees, in-house team costs, creative production, tools, and technology — while typically excluding product COGS and operations.
ROMI Formula: ROMI = (Revenue − Marketing costs) ÷ Marketing costs × 100%
Example of ROMI calculation: Revenue is $80,000. Marketing costs are: $10,000 ad spend + $5,000 agency fee + $2,000 creative production = $17,000. ROMI = (80,000 − 17,000) ÷ 17,000 × 100% = 371%
For every dollar invested in marketing, the function returned $3.71 above cost.
ROMI / marketing ROI is particularly valuable when reporting to business stakeholders who want to understand whether the marketing function as a whole is contributing to growth — not just whether individual campaigns are converting. If ROAS looks excellent but ROMI is low, indirect costs are eroding the margin.
Ad cost share expresses advertising spend as a percentage of revenue — the inverse of ROAS stated as a percentage. In eCommerce and retail, this is often the format used to set KPIs: "keep ad cost share below 15%."
Ad Cost Share formula: Cost share = Ad spend ÷ Revenue × 100%
Example of ad cost share calculation: $10,000 spend on $50,000 revenue = 20% cost share
As illustrated earlier, cost share targets set against gross order value — rather than actual collected revenue — will systematically misrepresent campaign profitability in businesses with meaningful return or non-fulfillment rates.
The common thread: none of these metrics is meaningful without knowing your actual margin. A 5x ROAS and a 20% cost share can both indicate profitability or loss depending entirely on the unit economics underneath them.
ROAS vs ROI and ROI vs ROAS comparisons come up constantly in PPC discussions. The short version: ROAS is faster and easier to compute in-platform, but ROI tells you whether the business is actually benefiting from the advertising. Use ROAS for optimization; use ROI for strategy.
Setting a ROAS target without grounding it in margin math is one of the most common strategic errors in PPC management.
Break-even ROAS is the minimum ROAS at which your campaigns neither gain nor lose money — the floor below which advertising destroys value.
Formula: Break-even ROAS = 1 ÷ Gross margin
Example: If your gross margin is 30%, break-even ROAS = 1 ÷ 0.30 = 3.33x. Any campaign running below that is unprofitable, regardless of what the dashboard shows.
Break-even ROAS calculator: Divide 1 by your margin expressed as a decimal. A 25% margin means break-even at 4x. A 40% margin means break-even at 2.5x. A 10% margin means you need 10x ROAS just to cover product costs — before ad spend, operations, or logistics.
Target ROAS should reflect both the break-even point and the desired profit margin above it.
If your break-even ROAS is 3.33x and you want to retain a 15% profit after ad costs, you need ROAS high enough to cover COGS and leave 15% behind. The exact calculation depends on your cost structure, but the principle is the same: target ROAS must be derived from real unit economics, not industry or PPC benchmarks or arbitrary goals.
A critical refinement: target ROAS should vary by product category. Running a single target across a catalog with mixed margins is a structural mistake — it over-spends on low-margin products and under-invests in high-margin ones. The solution is segmenting campaigns by margin band and setting distinct targets for each.
"For businesses that have worked with us for years, we use a deep approach to profitability management. Through analysis of the product mix, demand characteristics, and CRM data, we make decisions that affect not just advertising efficiency, but the business's financial results as a whole."
— Yevhen Kolotilo, PPC Expert at Promodo
Before touching campaign settings, understand the actual numbers: fulfillment rate, product margin, return rate, and operating costs. Optimizing ROAS against gross order value when your fulfillment rate is 55% is like navigating with a broken compass — directionally wrong from the start.
One of the most impactful levers for improving PPC ROI is controlling which products receive advertising budget — and how much.
At Promodo, we use an adapted ABC/XYZ analysis to segment SKUs by business value and performance. The data consistently reflects the Pareto principle: roughly 20% of SKUs generate up to 80% of actual profit. Concentrating the budget on that 20% has more impact on PPC profitability than any bid optimization technique.
Products that generate sales but miss profitability KPIs, and products with spend and traffic but no conversions, both require their own campaign structures and management rules — not the same treatment as top-performing SKUs.
Product profitability isn't static. A price change from a supplier, a seasonal markdown, a promotional discount, or a drop in fulfillment rate can turn a profitable SKU into a loss-maker within weeks.
This is especially visible in fashion retail and seasonal categories, where algorithms continue to push products from old collections because of their conversion history — even when those collections now carry significantly lower margins.
Regular profitability reviews at the SKU level, not just at the campaign level, are essential.
In large eCommerce accounts, a substantial share of the catalog may never enter Google Ads auctions. These are often called zombie SKUs — products with no impressions, no spend, no data.
Not all of them are dead weight. Often, the algorithm simply lacks sufficient signals to prioritize them, or they're consistently outcompeted by SKUs with stronger conversion histories. Separating zombie SKUs into dedicated campaigns, away from high-history products, frequently reveals items that generate solid sales when given the chance.
Before removing a product from advertising entirely, analyze why it's not showing — then test it in isolation before making the decision permanent.
If the algorithm trains on all recorded orders equally, it learns to find users who place orders — including users who cancel, return, or generate fraudulent transactions. The result is a system optimized for the wrong outcome.
For businesses where profitability is the primary KPI, the solution is to pass only quality conversions to Google Ads: specifically, orders that have been fulfilled and paid, transmitted through CRM integration and Conversions API (CAPI).
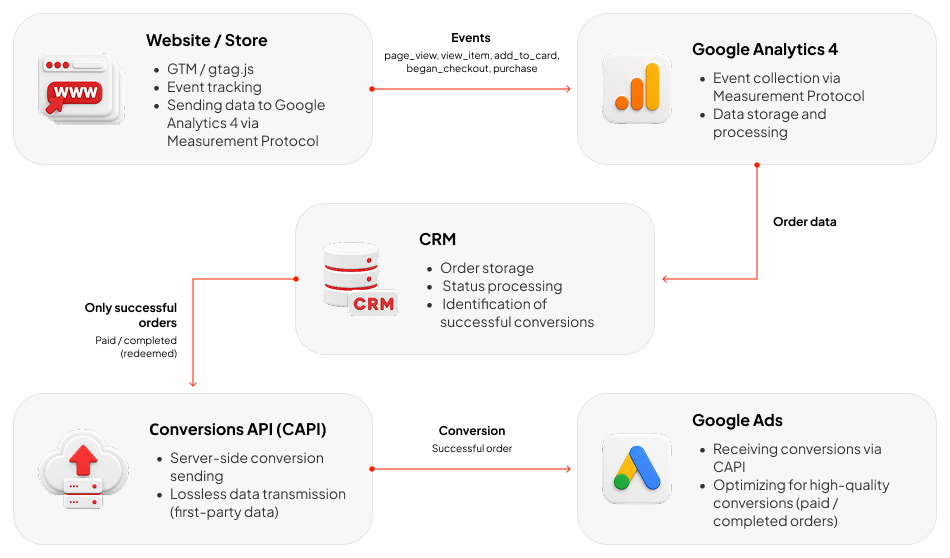
The technical stack for this approach:
The speed of data transmission matters as much as data quality. Google Ads is sensitive to delays. Ideally, an order receives its "successful" status within 24 hours and is passed to the ad platform immediately.
"The ideal scenario is when an order receives a 'successful' status within a day and is immediately sent to Google Ads. In that case, the system trains on current data and optimizes campaigns correctly."
— Yevhen Kolotilo, PPC Expert at Promodo
If CRM updates are delayed by several days, restricted to business hours, or the store doesn't process orders on weekends, the effectiveness of this approach drops significantly. The algorithm begins making decisions on stale or incomplete data — directly impacting optimization quality.
Even the best product strategy fails if decisions are based on incorrect data. Regularly audit which conversions are flowing into your ad systems and whether they correspond to actual business results.
Attribution is equally critical. Last-click models systematically undervalue upper-funnel campaigns that build awareness and drive demand but don't close the final sale.
A user may first encounter a product through Performance Max or a YouTube ad, then convert via a branded search campaign days later. Under last-click attribution, the brand campaign gets full credit — and the awareness campaign looks like a budget drain.
For most eCommerce businesses, Data-Driven Attribution gives a more accurate picture of how campaigns contribute to the path to purchase. Pair it with regular path-to-conversion analysis to understand how your campaigns interact before making budget cuts based on surface-level ROAS.
Applying a single target ROAS or cost share across a mixed-margin catalog is structurally guaranteed to misallocate budget. Accessories with 50% margins and electronics with 10% margins cannot share a target without one of them being systematically over- or under-invested.
High ROAS doesn't mean high profitability. Campaigns that sell heavily discounted products or categories with minimal margins can show excellent ROAS while contributing almost nothing to business profit. Evaluate performance through margin, actual profit contribution, and real return on investment — not ROAS alone.
Google Ads algorithms optimize based on accumulated conversion data. This means they naturally favor products with strong conversion histories — even when those products have lost profitability. In fashion specifically, old collections accumulate signals over time and receive disproportionate budget, while new, higher-margin collections struggle to gain traction.
If you're not actively managing the product-algorithm relationship, the system optimizes for history rather than current business objectives.
Every return, cancellation, and fraudulent order that enters your ad platform as a conversion degrades the algorithm's ability to find real buyers. This isn't a minor inefficiency — at scale, it fundamentally distorts the audience signals the system is learning from.
Assessing profitability through last-click attribution penalizes every campaign that isn't the final touchpoint before conversion. Upper-funnel campaigns — especially on YouTube, Display, and Performance Max — frequently show poor last-click ROAS while doing significant work in building the demand that lower-funnel campaigns eventually capture.
Real PPC profitability management goes beyond what any ad platform dashboard can show. It requires understanding your business economics — margins, fulfillment rates, return rates, operating costs — and using that data to drive every decision, from bid strategy to product selection to attribution modeling.
At Promodo, we work deeply with clients' product catalogs, niche-specific demand patterns, and CRM data to understand real buyer behavior. This lets us see past ad metrics into actual business dynamics — which products generate profit, where losses occur, and how demand behaves across different segments.
Only after that analysis do we build and launch PPC strategies that account for margin, fulfillment rates, and market specifics — designed for stable, predictable business profitability rather than vanity metrics.
[[FAQ-START]]
There's no universal benchmark. A good ROAS is one that exceeds your break-even ROAS given your actual product margins. For a 25% margin, break-even ROAS is 4x — anything above that is profitable. For a 10% margin, you need 10x ROAS before accounting for operating costs. Industry averages exist, but margin structure always overrides them.
ROAS = Revenue from ads ÷ Ad spend. If you spent $5,000 and generated $25,000 in revenue, your ROAS is 5x. Note that this is gross revenue — to understand true profitability, you need to factor in margin and fulfillment rate.
ROAS measures revenue per dollar of ad spend and ignores all costs except advertising. ROI measures return on total investment, including product costs, operations, and logistics. ROAS is faster and easier to track in-platform; ROI tells you whether the business is actually profitable. Use both — ROAS for daily optimization, ROI for strategic decisions.
ROMI (Return on Marketing Investment) measures the profitability of the entire marketing function, not just ad spend. The formula: (Revenue − Total marketing costs) ÷ Total marketing costs × 100%. Marketing costs include ad spend, agency fees, creative production, and tools. ROMI is useful for evaluating marketing as a business function and for reporting to stakeholders who need to see beyond campaign-level metrics.
PPC ROI = (Revenue from PPC − Ad spend − COGS − Operating costs) ÷ (Ad spend + COGS + Operating costs) × 100%. In practice, this requires integrating ad platform data with CRM and financial data. Most PPC teams approximate ROI by combining campaign-reported revenue with margin data provided by the client. Full ROI calculation is most relevant for strategic budget decisions rather than daily optimization.
Break-even ROAS is the minimum ROAS at which your campaigns cover costs without generating profit or loss. Formula: 1 ÷ Gross margin. At a 30% margin, break-even ROAS is 3.33x. At a 20% margin, it's 5x. Any campaign running below break-even ROAS is losing money in real terms, regardless of how it looks in the ad platform.
[[FAQ-END]]
Team Lead of Content for promodo.com
Experienced in working with data, expert recommendations, and real business cases to create clear and valuable content that delivers real business impact. Passionate about discovering new insights, exploring industry trends, and turning complex topics into practical, easy-to-understand content.
Team Lead PPC at Promodo
You may also like
Choose quality and trusted services to improve the presence of your company on the Internet, and feel free to contact our UK team if you have any questions.

Outbound links are URLs on your website that link externally to other web properties.

Local SEO for dentists is no longer optional — it’s essential for staying visible in one of the most competitive markets in the U.S.

Find out the key content marketing trends for 2026 that deserve a spot in your content marketing strategy.
We at Promodo are ready to help you improve your performance across all digital marketing channels.
Get started