Ukraine eCommerce Market Report H1 2026: Revenue, Traffic & Category Trends

Written by
Hanna Sytnyk

Marketing Specialist at Promodo

I have been working in marketing since 2012 with an emphasis on market research and analytics. I am experienced in the following niches: food wholesale, insurance, real estate, and software distribution. I have been responsible for Promodo's cases since 2021. Doing marketing research, I focus on causes and effects, as well as measurable results.

Researches
August 20, 2026
18 mins
ukraine ecommerce market 2026
Content

Ukraine's eCommerce market kept growing in the first half of 2026 despite the country's most severe wartime energy crisis to date. Revenue increased in six of seven major categories compared to H1 2025, led by Consumer Electronics (+56% UAH / +50% USD) and Automotive Parts (+25% UAH / +19% USD). Growth is increasingly driven by a higher average order value and better conversion rates rather than by new customer acquisition — a sign the market is maturing even under wartime conditions.

This report is based on Promodo's proprietary analysis of weighted-average performance across dozens of Ukrainian online stores in seven major retail categories, comparing H1 2026 to the same period in 2025.


Key Takeaways

  • Ukraine's eCommerce market grew in H1 2026 despite the most severe energy crisis of the full-scale war and continued missile and drone strikes on logistics infrastructure.
  • Consumer Electronics led growth at +56% in revenue (UAH), driven by demand for laptops and power banks amid blackouts, plus a Buy Now, Pay Later (BNPL) campaign on Apple products.
  • Average order value, not new traffic, is now the main growth driver in most categories — a shift from the volume-led growth seen in late 2025.
  • AI and bot traffic surged in 2026, distorting standard analytics; in Fashion & Apparel, bot traffic growth exceeded 200% year-over-year in June 2026 alone.
  • Organic search traffic declined in 4 of 7 categories (Electronics, Pet Care, Pharmacy, Jewelry), likely linked to Google's AI Overviews answering queries directly in search.
  • 56% of Ukrainians now shop online at least a few times a month, and 19% shop weekly — regular online shopping habits keep strengthening.
  • BNPL / installment payments are becoming a competitive weapon, not just a payment option: a single Apple installment promotion by a Ukrainian bank generated over ₴1.42 billion in sales and 47,000+ orders in three days.
  • H2 2026 — the peak Black Friday and holiday season — carries elevated risk from energy instability and attacks on warehouses and logistics, meaning the challenge may be supply and inventory, not demand.

Research Scope & Methodology

This report compares weighted-average performance across seven major Ukrainian eCommerce categories — Consumer Electronics, Food & Beverage (incl. alcohol), Pet Care, Fashion & Apparel, Pharmacy, Jewelry, and Automotive Parts — for January–June 2026 vs. January–June 2025. H2 2025 data is used as additional context to track market momentum.

Note: in the Google Ads channel breakdown, "Cross-network" corresponds to Performance Max campaigns, which run across multiple Google ad surfaces simultaneously.

Who This Report Is For

  • Business owners and eCommerce leaders evaluating growth opportunities in the Ukrainian market.
  • Marketers and growth teams who need to benchmark performance and adjust strategy against real market dynamics.

The State of Ukrainian Business in 2026

H1 2026 tested the resilience of Ukraine's eCommerce sector once again. The year began during the most severe energy crisis of the full-scale war, with rolling blackouts affecting both consumers and businesses.

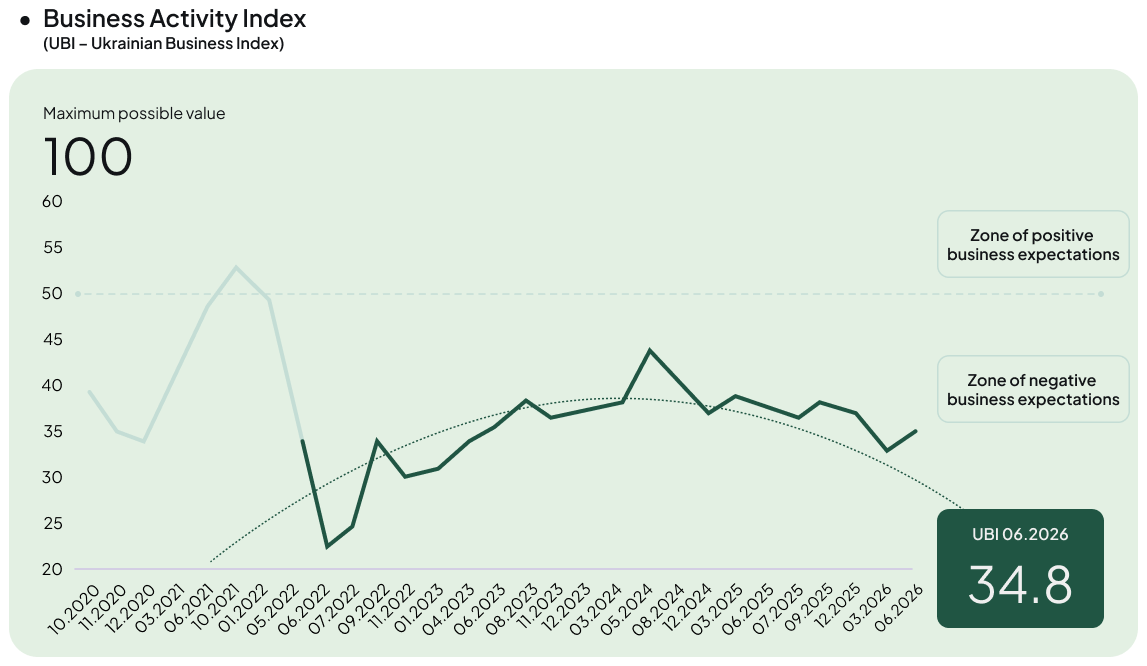
Overall business sentiment stayed cautious for most of the period. According to the Ukraine Business Index (UBI) from Diia. Business, the index stood at 32.9 out of 100 in March 2026. It climbed to 34.8 by June — still well below the neutral 50-point mark, signaling continued uncertainty about the pace of recovery.
Business activity index in ukraine


By early summer, near-term expectations improved somewhat: the National Bank of Ukraine's Business Activity Expectations Index (BAEI) stayed above the neutral threshold for a fourth consecutive month, reaching 50.4 in June. Growing external financial support, a more stable power grid, and resilient consumer demand all supported this improvement.

By the end of H1, however, expectations came under renewed pressure from security and energy risks. Intensified missile and drone attacks, strikes on logistics and warehouse infrastructure — including warehouse fires — and warnings about a difficult heating season all deepened uncertainty for businesses heading into H2.

The threat of power outages, and the need to prepare contingency plans (including possible relocation from the most exposed cities), is keeping businesses cautious in their planning. As a result, expectations for the second half of 2026 remain subdued, with security and energy risk continuing to be the key sources of uncertainty.

What's Reshaping Ukrainian eCommerce in 2026

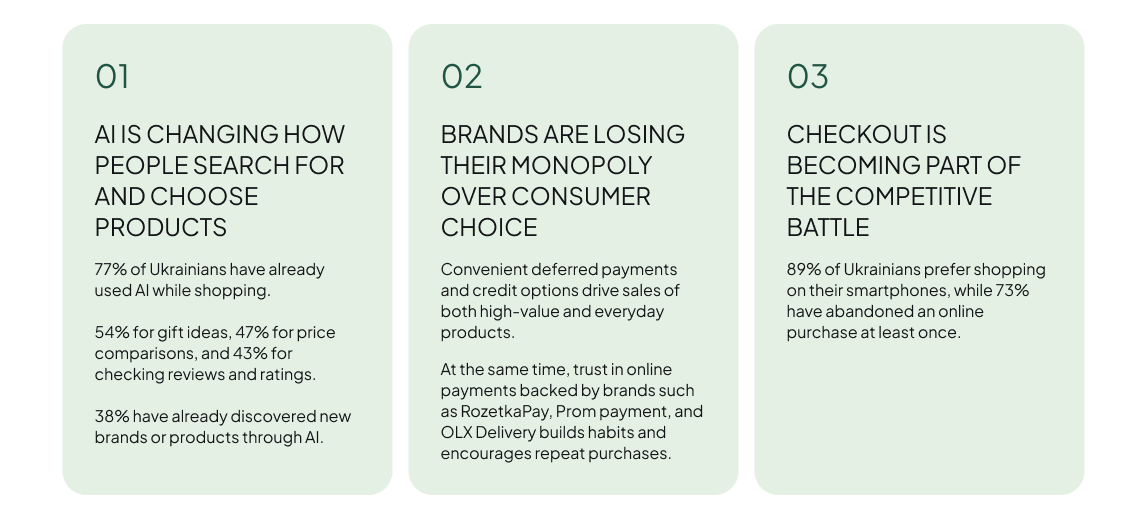
Ukrainian eCommerce kept evolving alongside shifting consumer behavior in H1 2026. New patterns in how people search for products, choose brands, pay, and complete checkout are reshaping the customer journey — driven by new technology, new payment options, and rising expectations for the online shopping experience.

Based on research from Visa (2), Gradus, and PROM.
ukrainian ecommerce drivers

BNPL Is Becoming a Competitive Advantage

Installment payments (BNPL) increase purchase frequency by an average of 15–20%. Ukrainian consumers now use installment plans not just for big-ticket purchases but for everyday items they previously paid for outright. As a result, market players are extending available installment terms — some offers now run to 24 months or longer.

For shoppers, this lowers the barrier to purchase. For businesses, it's a direct way to convert deferred demand into sales.

AI Traffic Interpretation: A New Factor in Analytics

AI and bot traffic is growing across most categories in 2026. These are two distinct phenomena: AI crawlers (bot traffic) scrape sites to train or ground LLMs and never convert, while traffic from AI assistants represents real users who arrived based on an AI recommendation. Crawlers, in particular, distort channel attribution and make audience-quality analysis unreliable.

Google Analytics has already broken out traffic from AI assistants — including ChatGPT, Gemini, and Claude — into a separate channel. But having a line item in the report doesn't mean all of that traffic is captured correctly: when a user copies a link from an AI response or navigates from within an app, the referrer is often lost, and GA4 logs the session as Direct instead.

In the Fashion & Apparel category, we detected abnormal crawler activity that was distorting traffic and conversion metrics, so we excluded it from our calculations for that category. We will continue monitoring this trend and adapting our methodology as needed — a topic we also cover in more depth in our guide on Generative Engine Optimization (GEO).

Want to Be Recommended by AI?
Start optimizing your AI search visibility with Promodo.

Top Ukraine eCommerce Trends for 2026

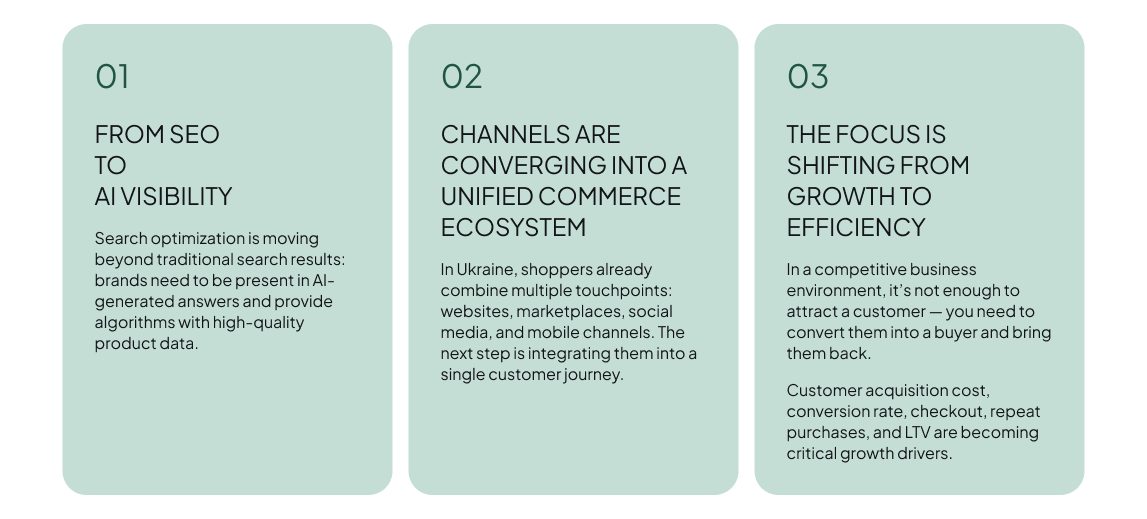
The defining trend of 2026 is a shift from managing individual channels to managing the entire customer journey. AI is changing how people search for and choose products, personalization is becoming systematic, and business focus is moving from traffic volume to traffic efficiency — its ability to generate sales and repeat purchases.
top ecommerce trends in ukraine 2026

Ukraine eCommerce Performance by Category (H1 2026 vs. H1 2025)

Charts are built on weighted-average metrics for each category, based on a sample of players with varying revenue scale. All figures compare H1 2026 to the same period in 2025.

The State of Consumer Electronics eCommerce in Ukraine

[[SLIDER-START]]

revenue of Consumer Electronics eCommerce in Ukraine

revenue of Consumer Electronics eCommerce in Ukraine
aov Consumer Electronics eCommerce in Ukraine
avarage order value Consumer Electronics eCommerce in Ukraine
number of users in Consumer Electronics eCommerce in Ukraine
google ads spends Consumer Electronics eCommerce in Ukraine
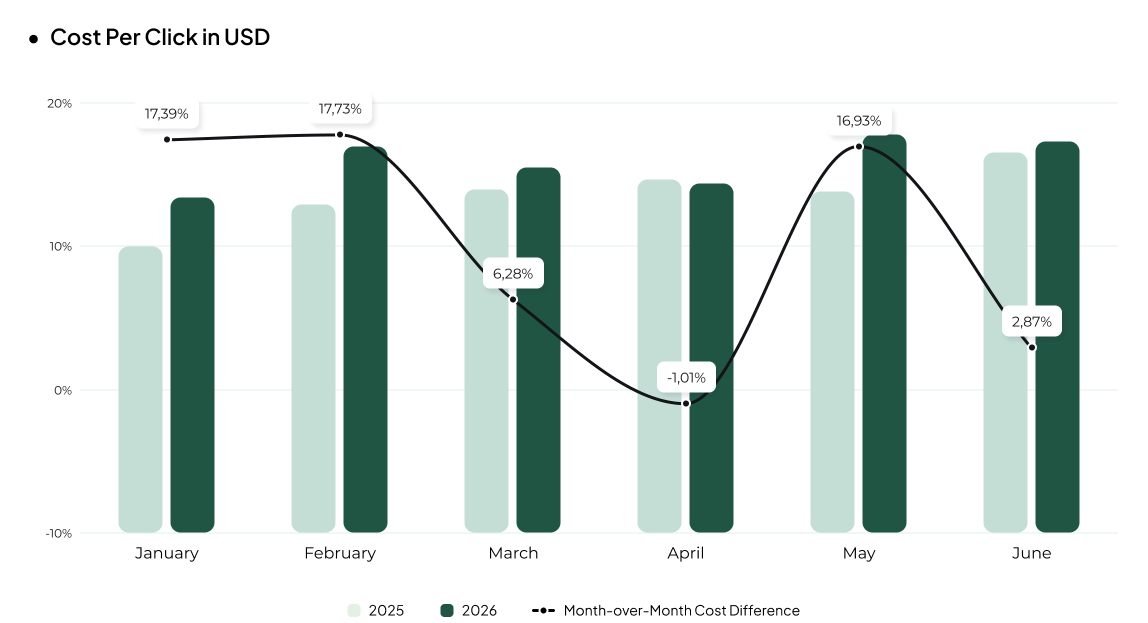
cpc Consumer Electronics eCommerce in Ukraine
traffic distrinution of Consumer Electronics eCommerce in Ukraine

[[SLIDER-END]]

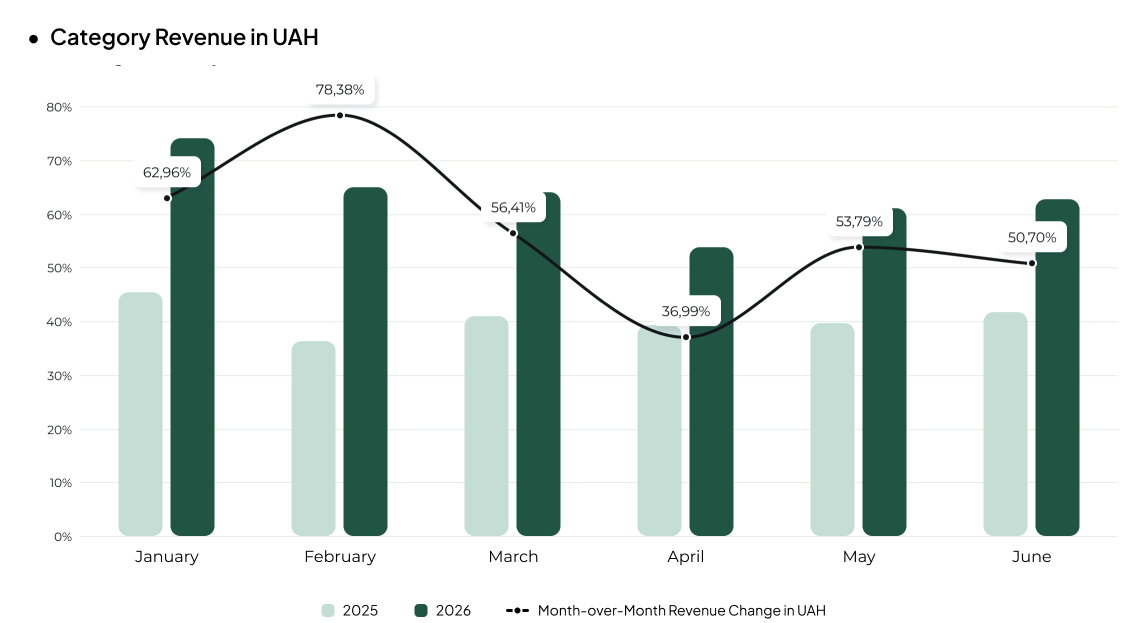
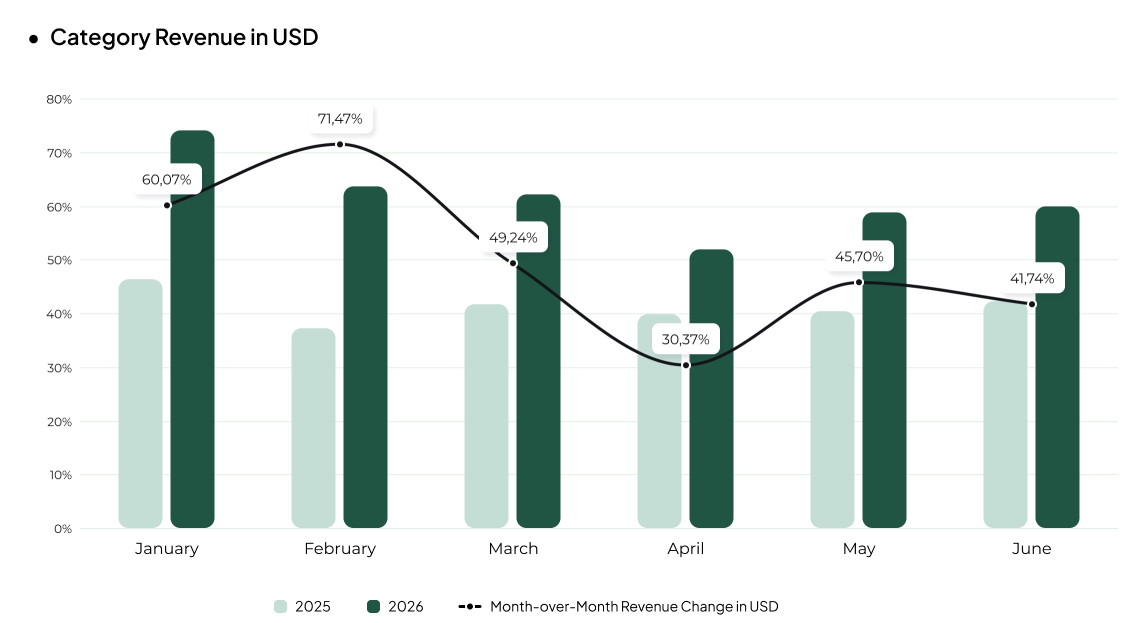
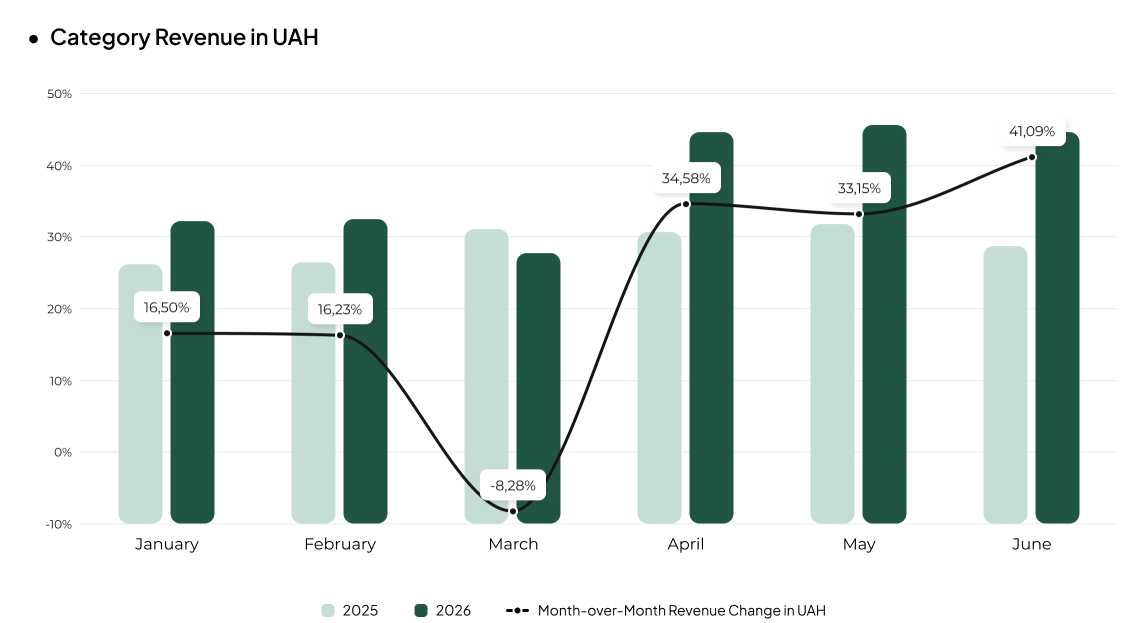
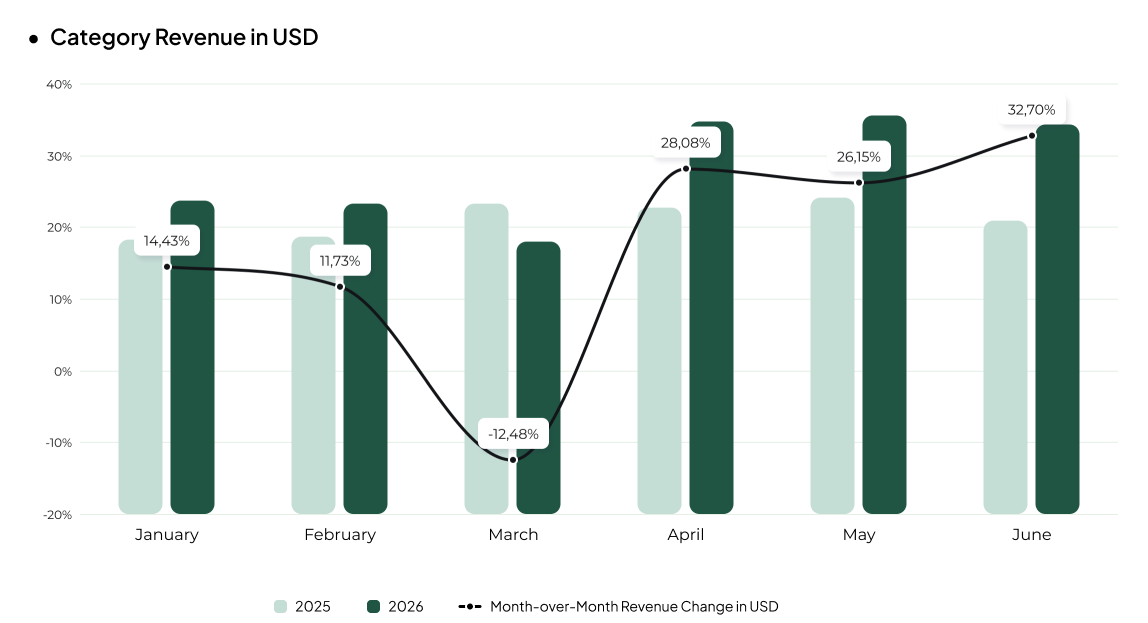
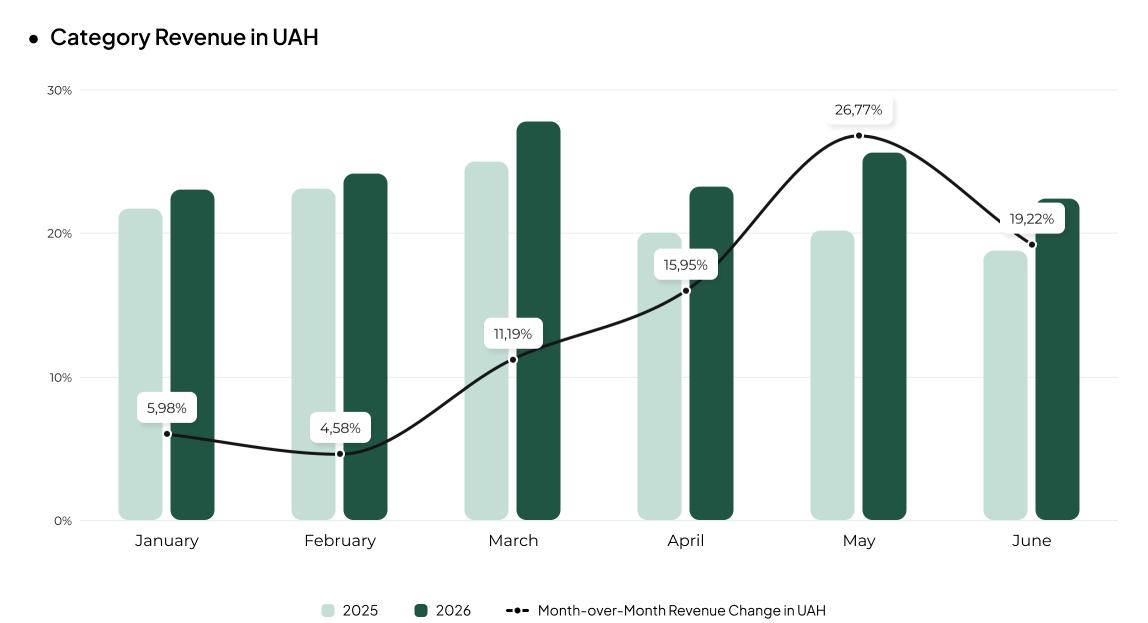
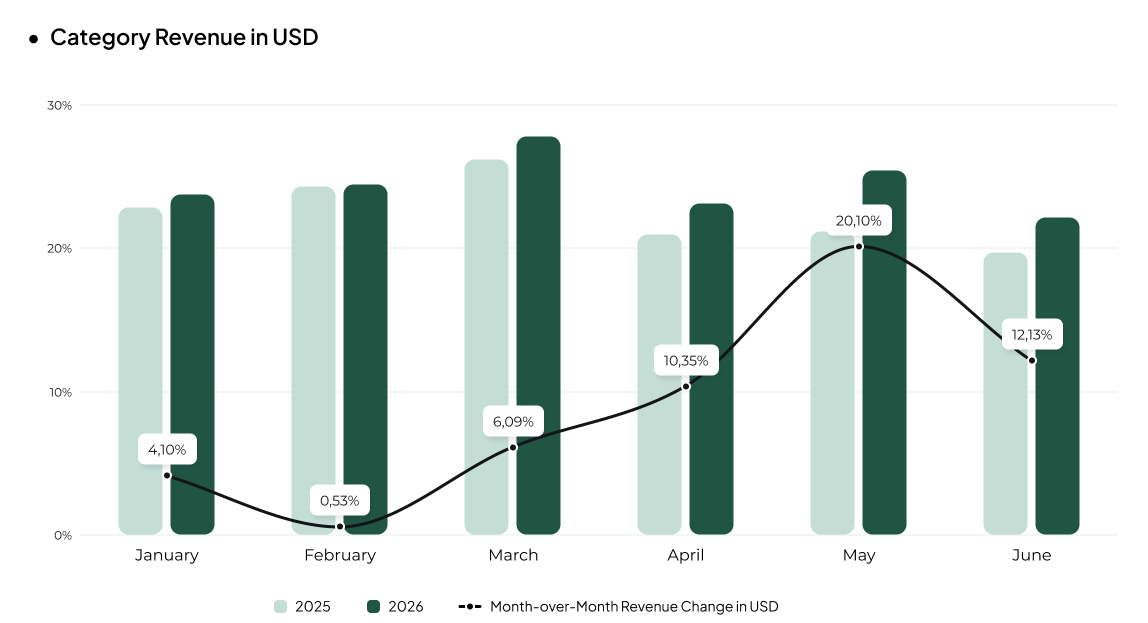
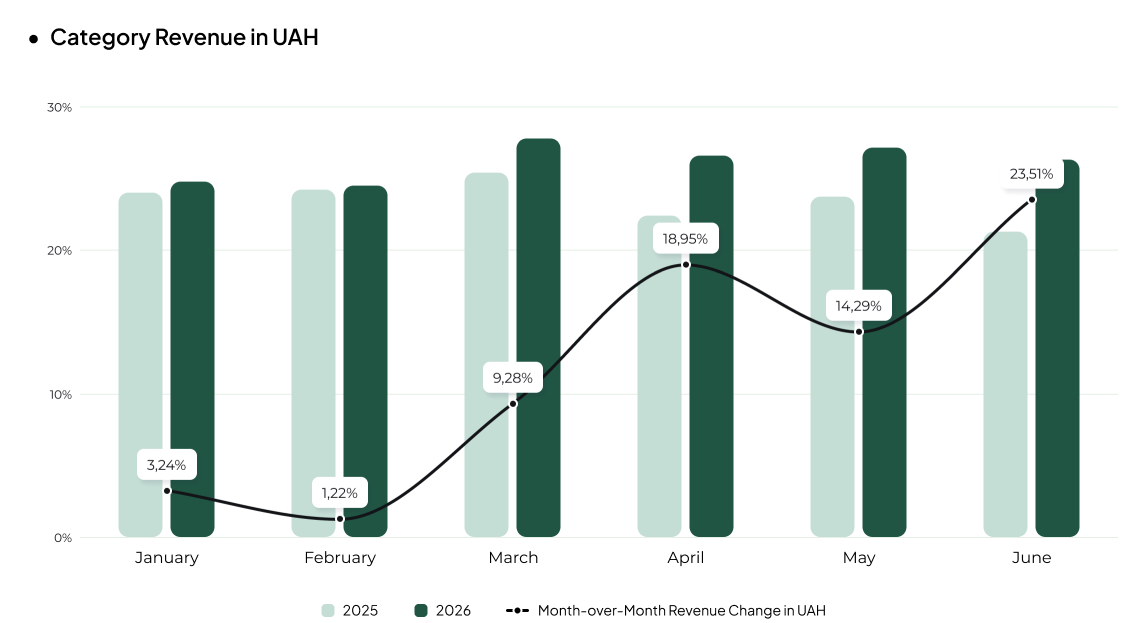
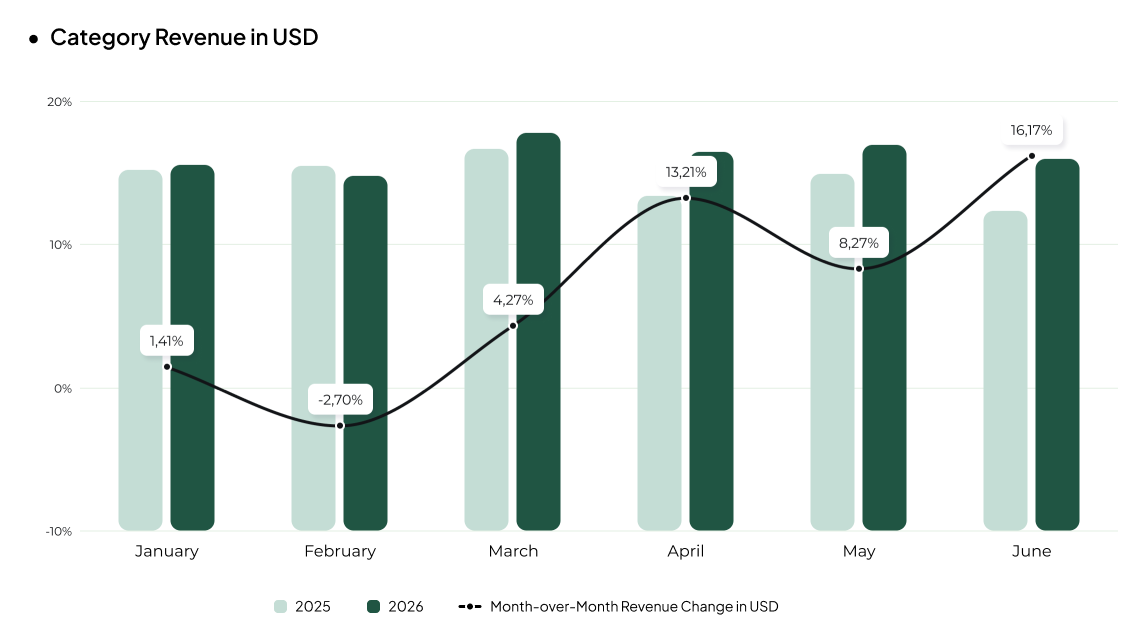
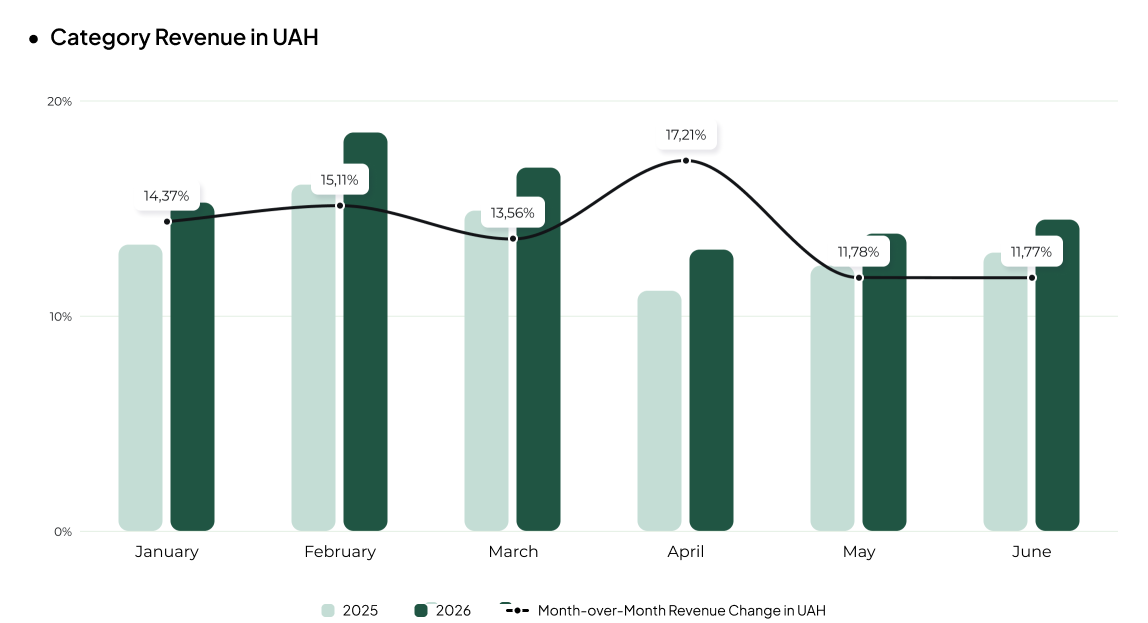
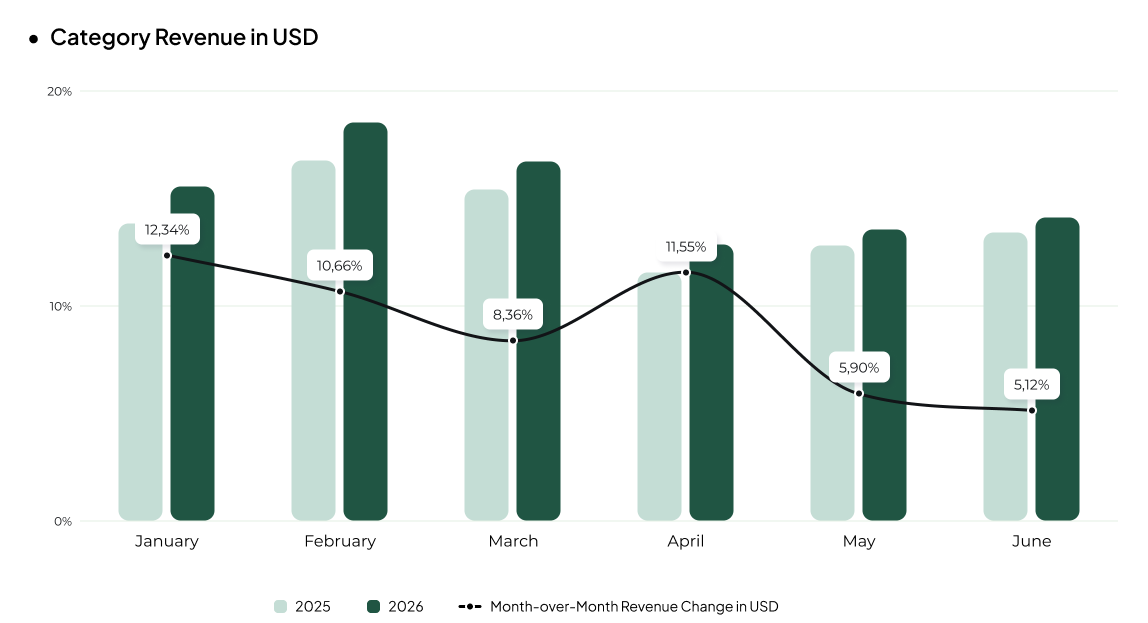
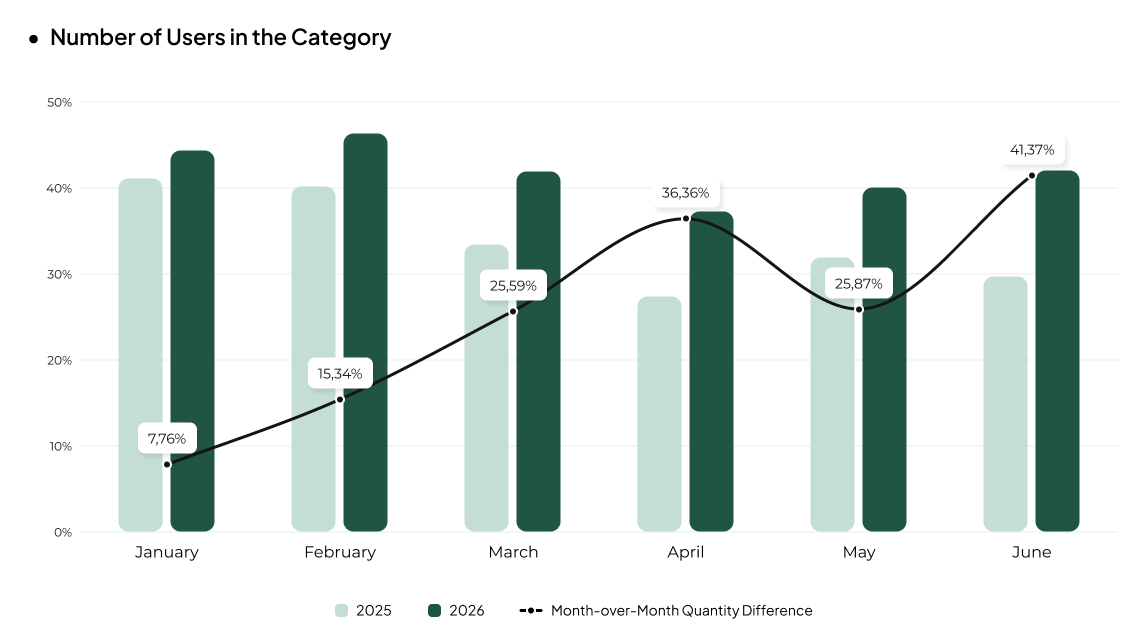
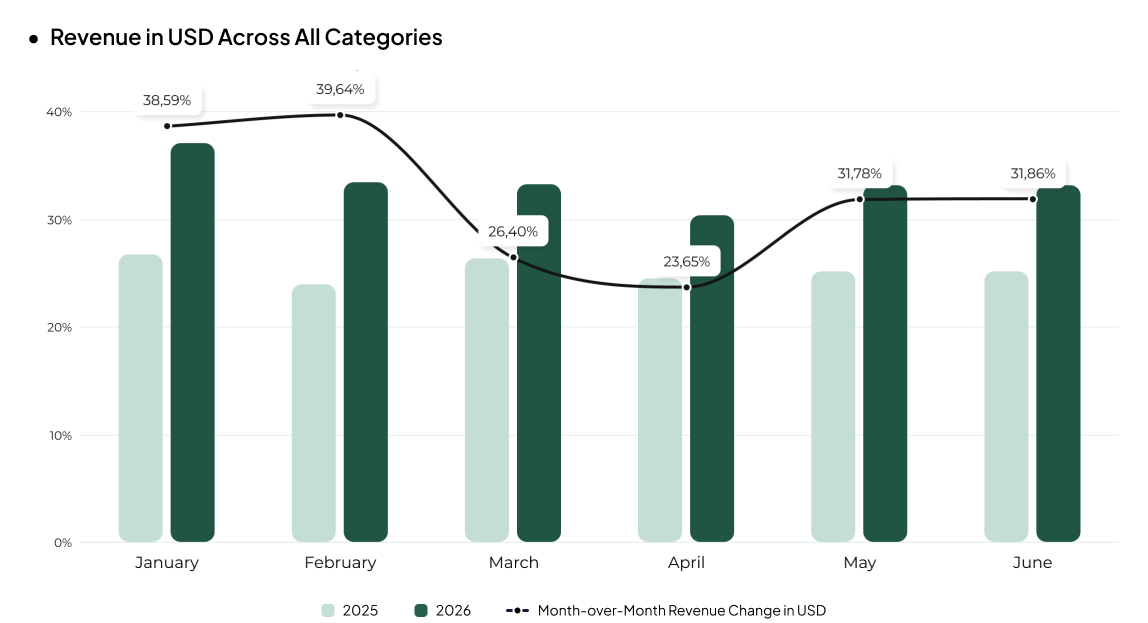
  • Revenue continued the growth trend that began in late 2025: up 56% in UAH and 50% in USD, with order volume up 25%. That said, growth in both revenue and order volume gradually slowed heading into summer as seasonal demand cooled.
  • Laptops and portable power stations were among the biggest revenue drivers, as extended power outages made device autonomy for work, study, and daily life a top priority for Ukrainian consumers.
  • After a dip in April, demand may have gotten an additional boost from a May promotion by monobank offering 20-installment BNPL on Apple products. The resulting surge in installment-based purchases likely supported demand for smartphones and other electronics and helped revenue recover in May.
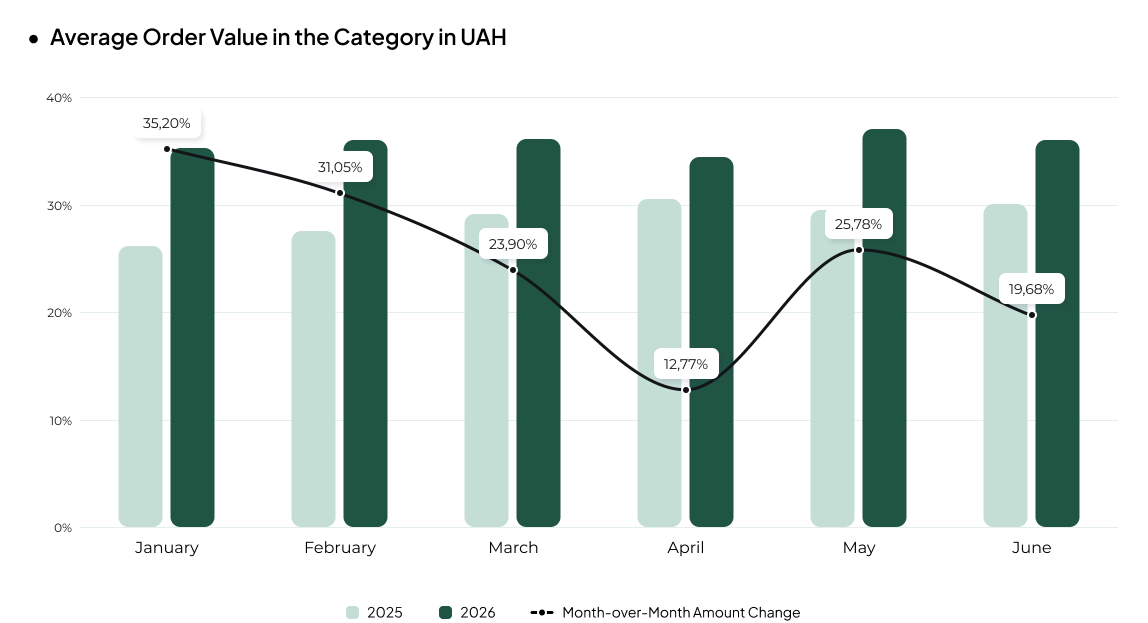
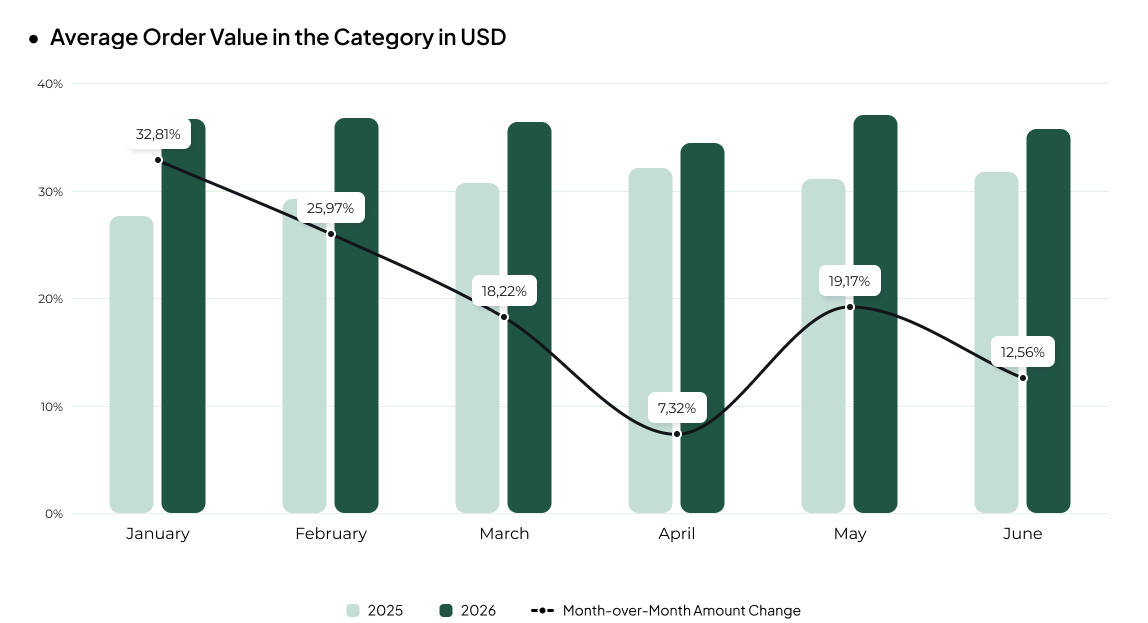
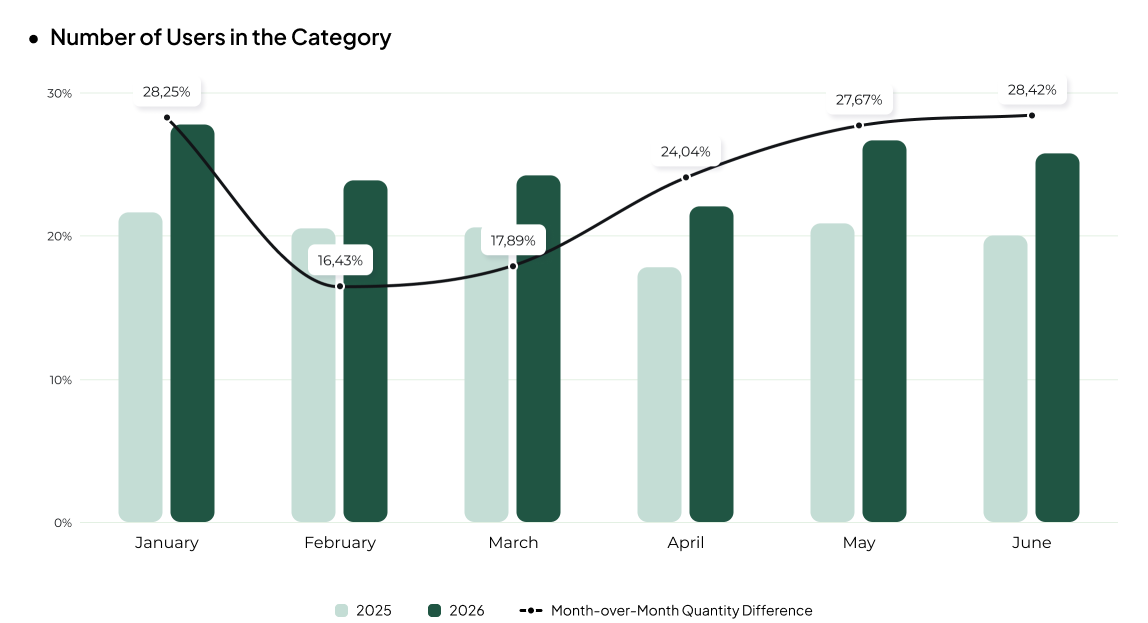
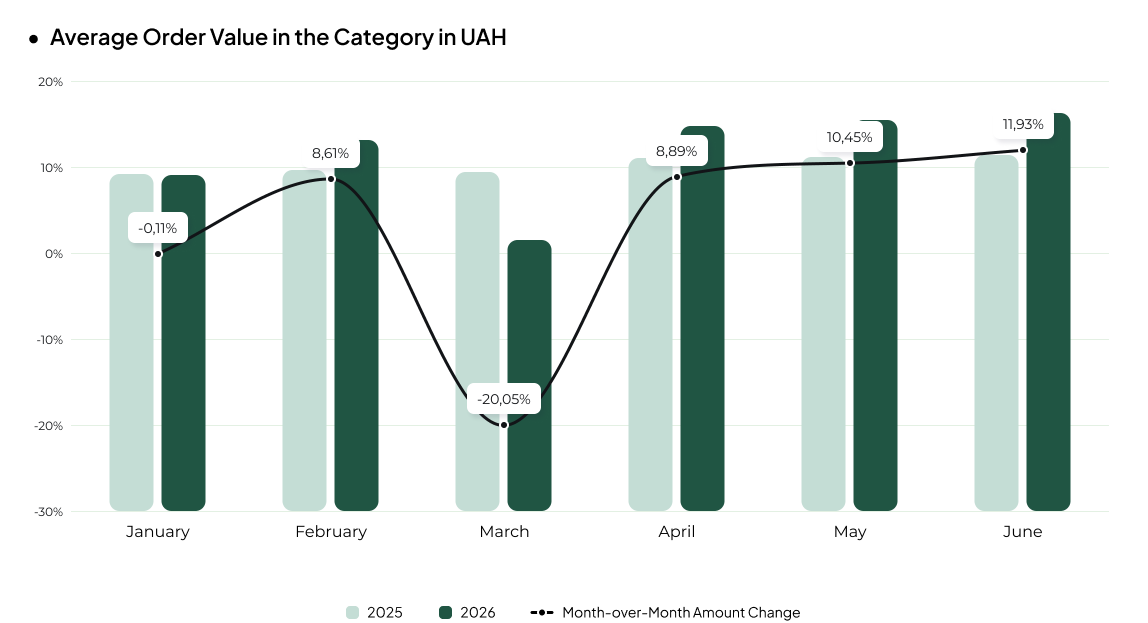
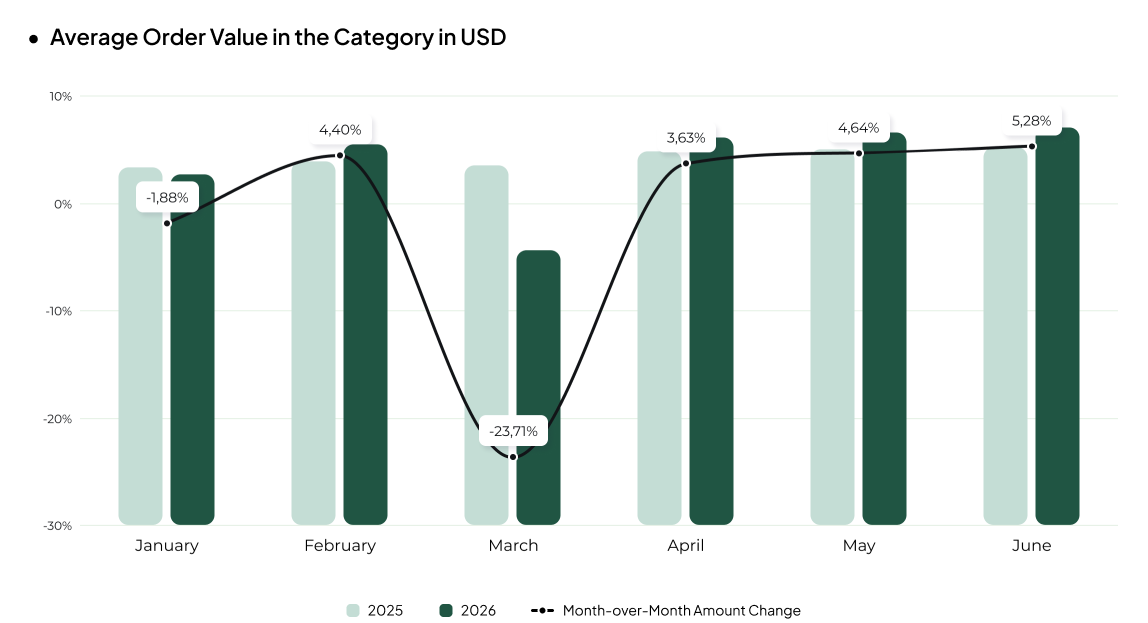
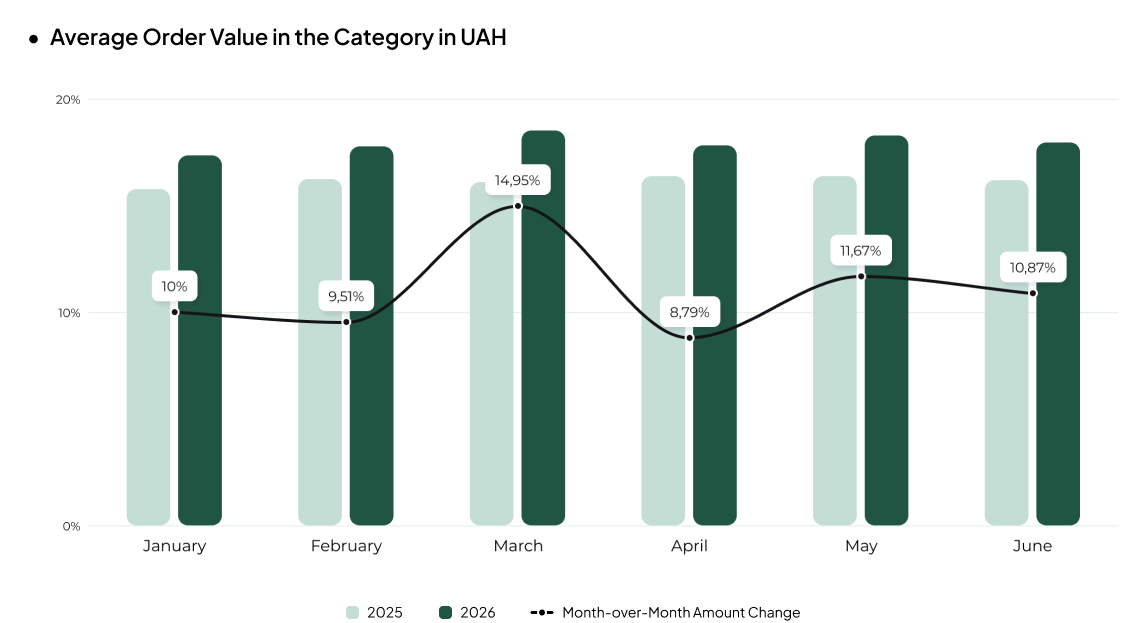
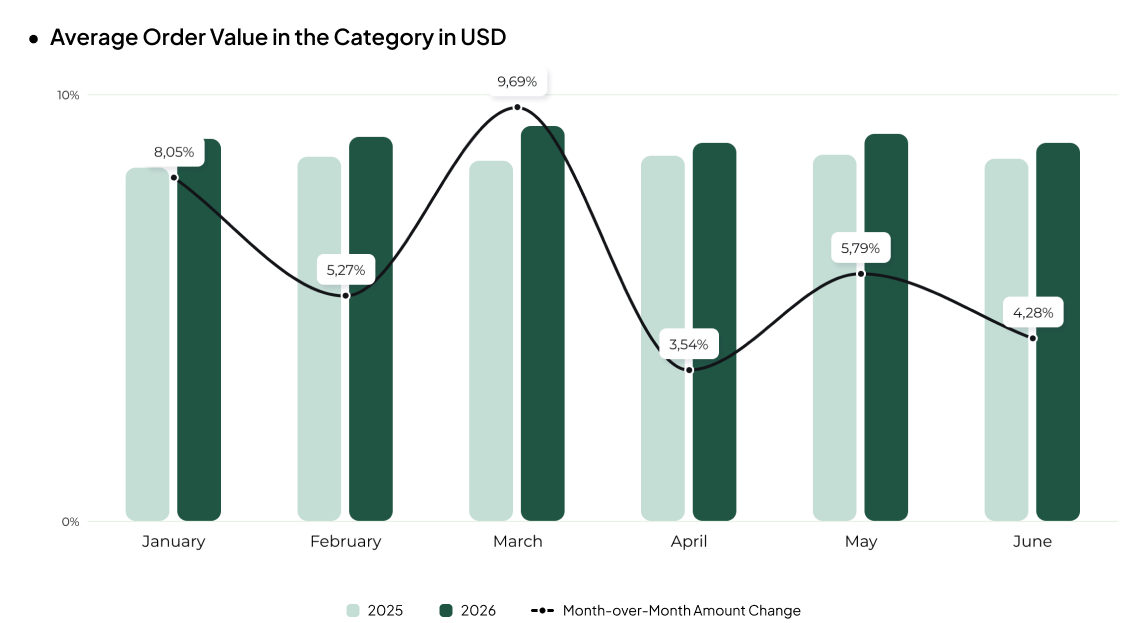
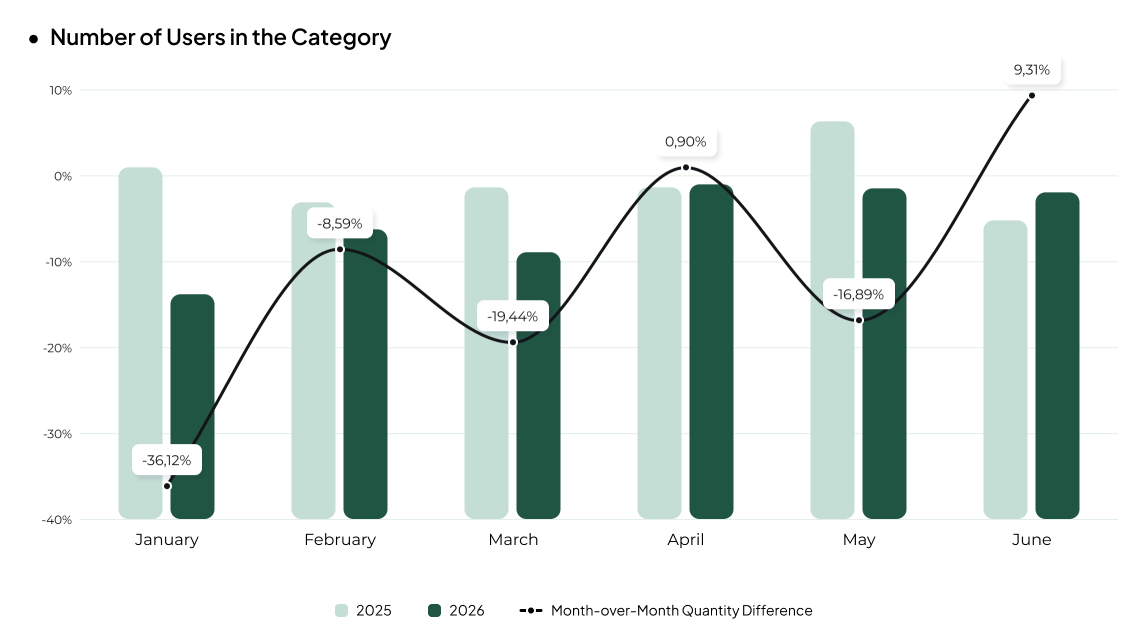
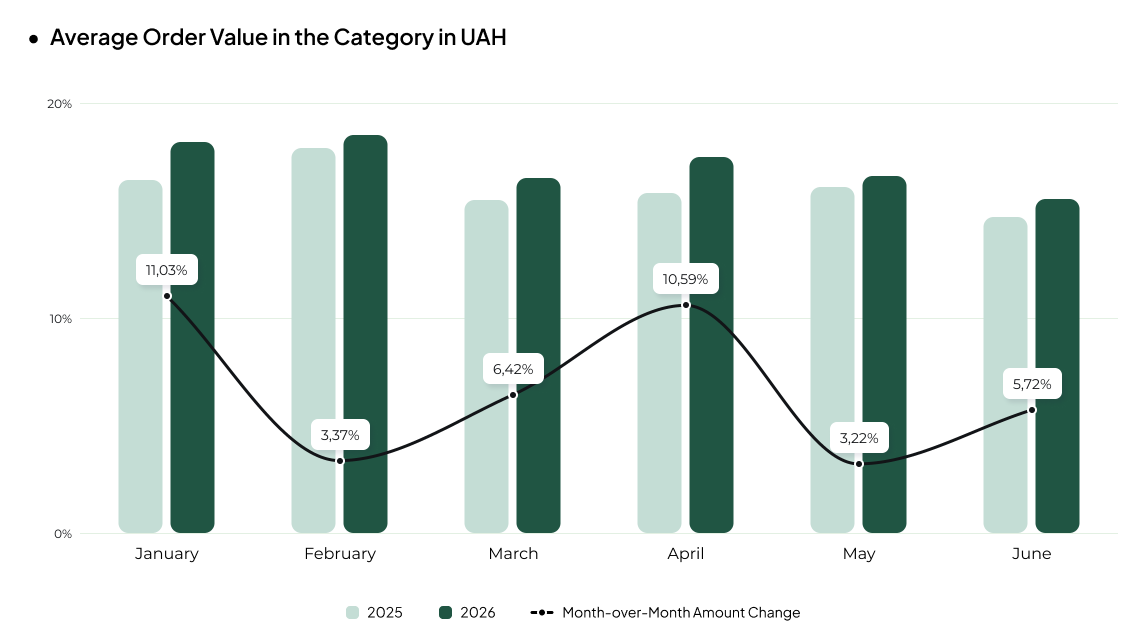
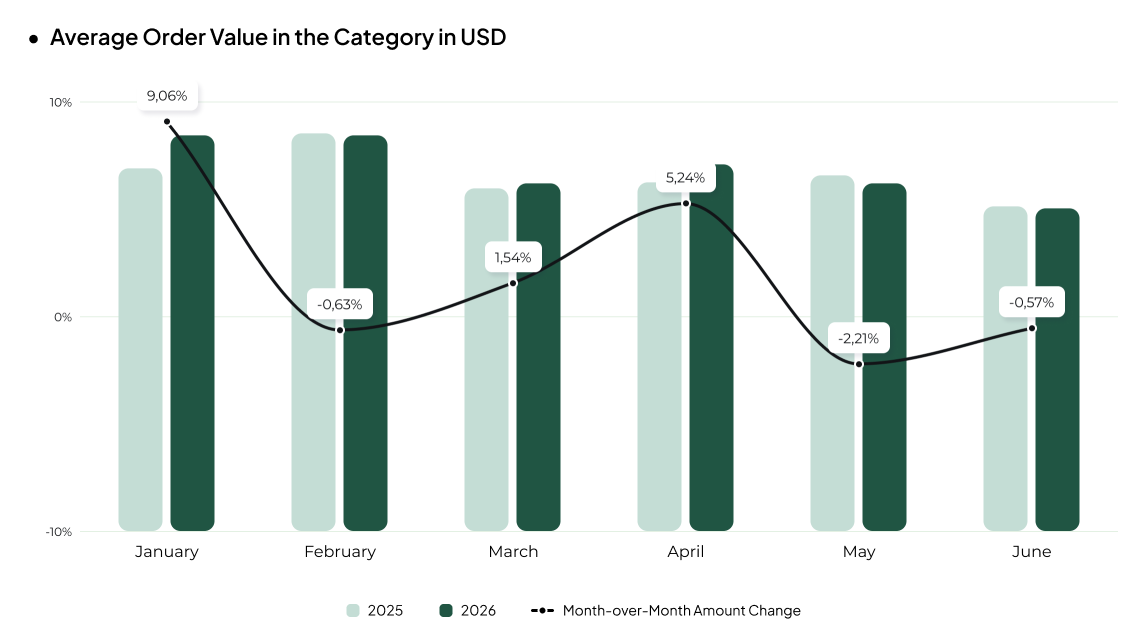
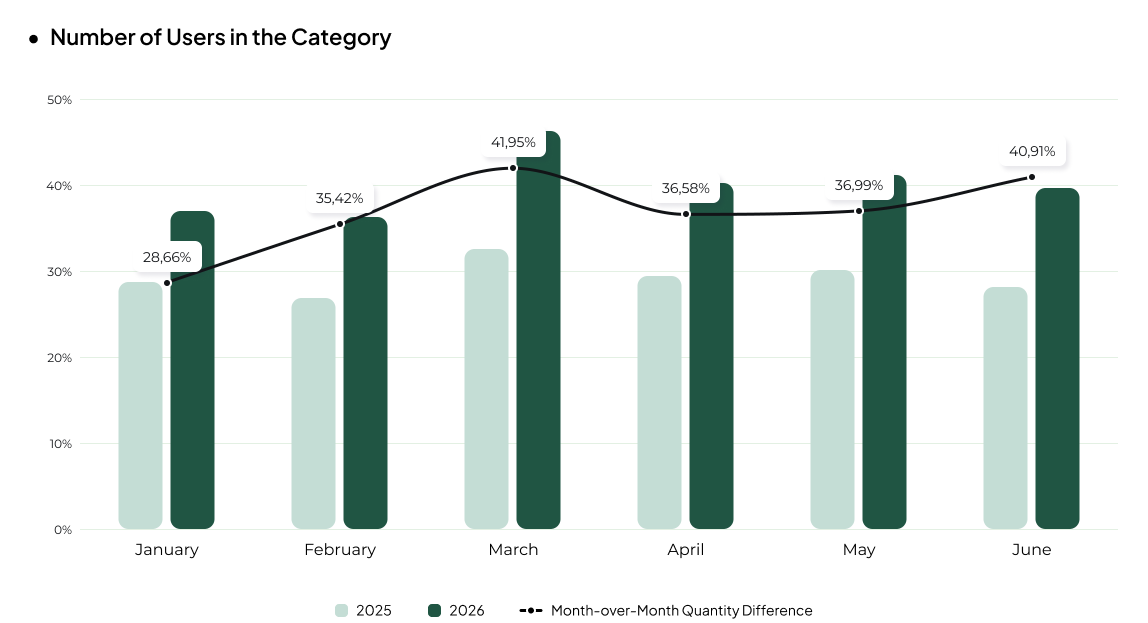
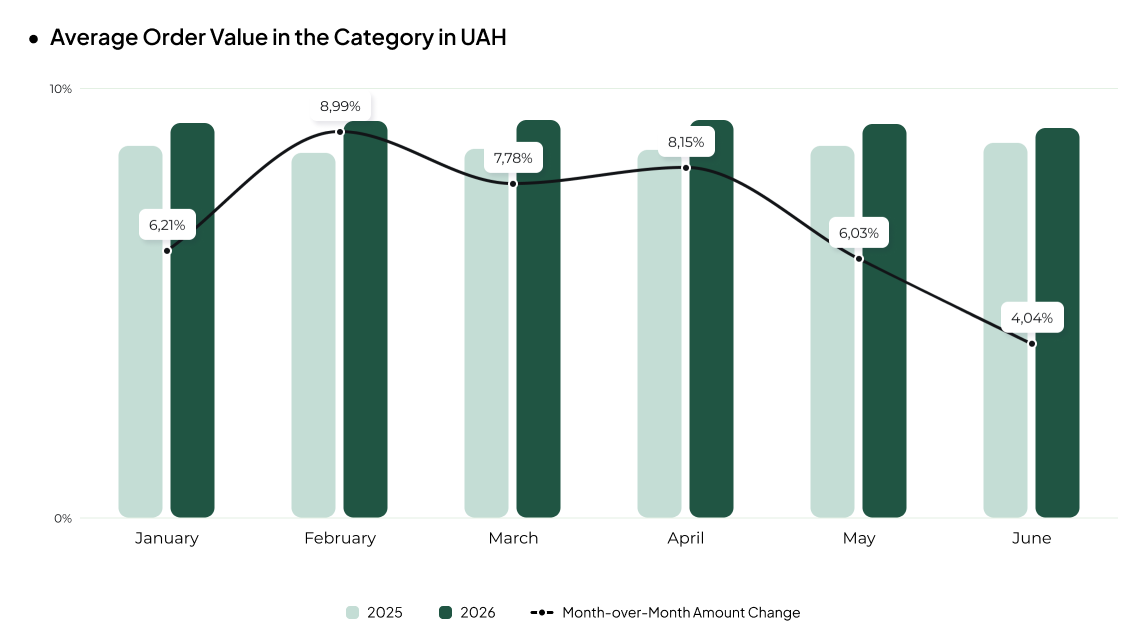
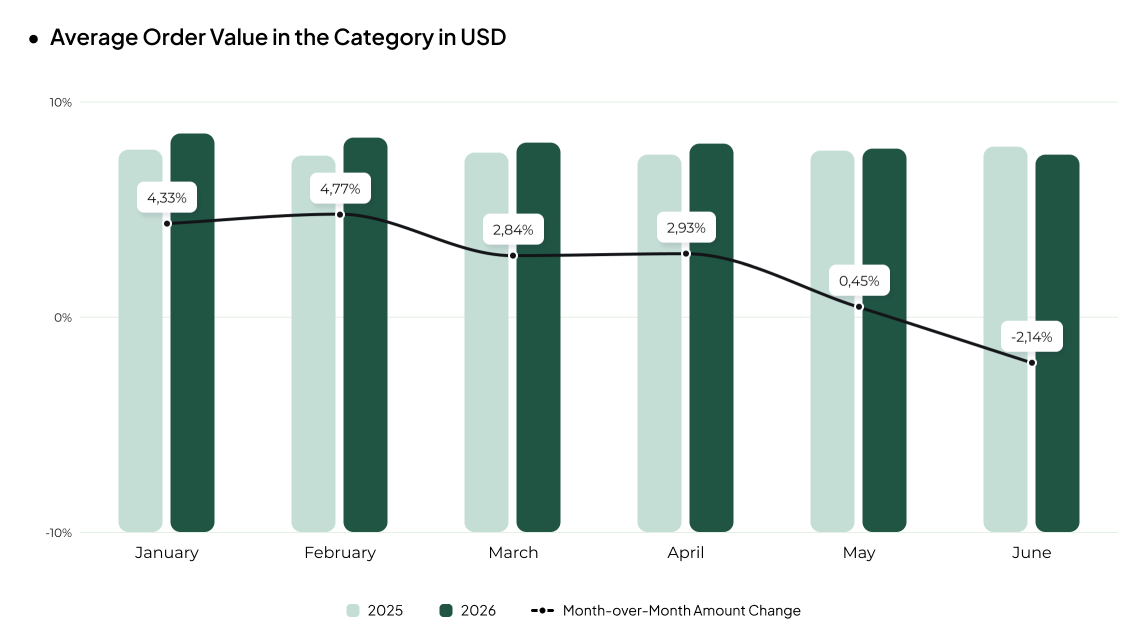
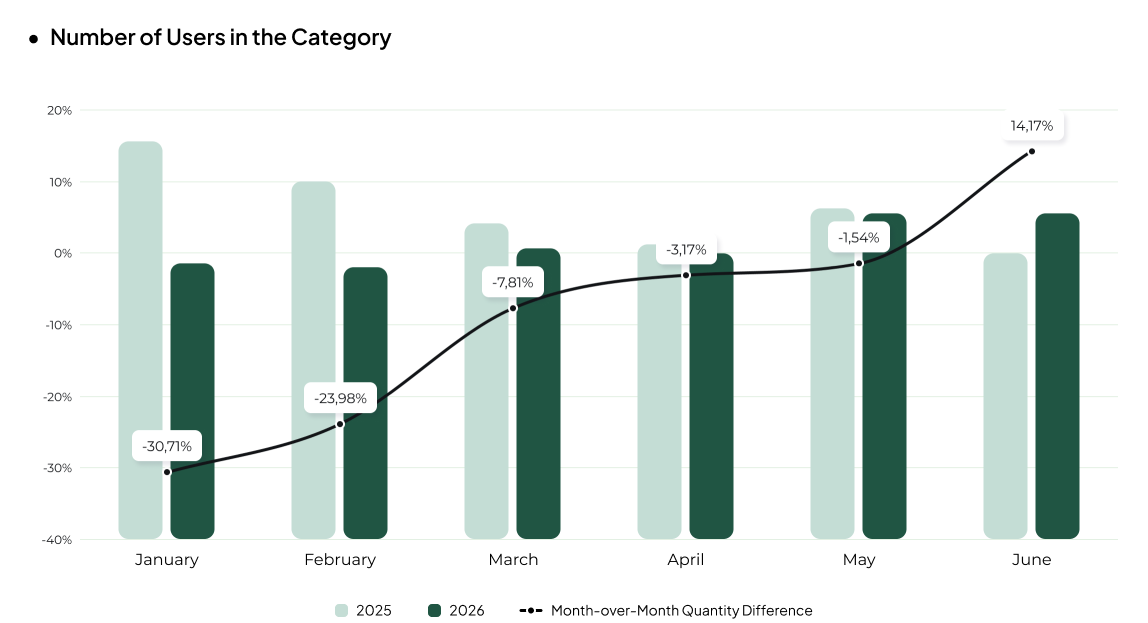
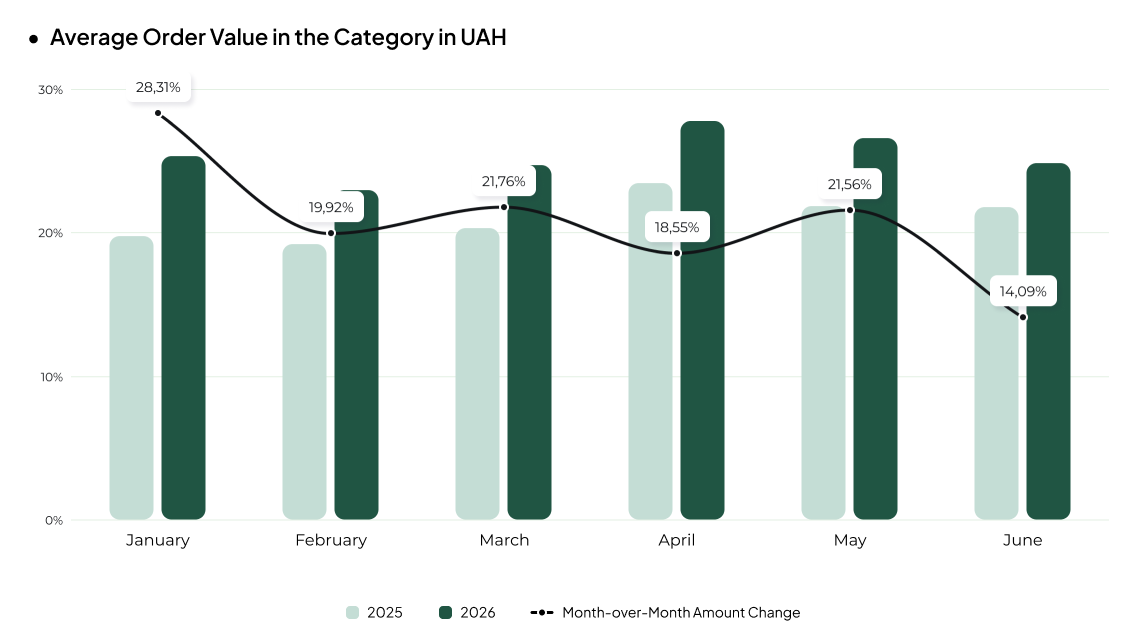
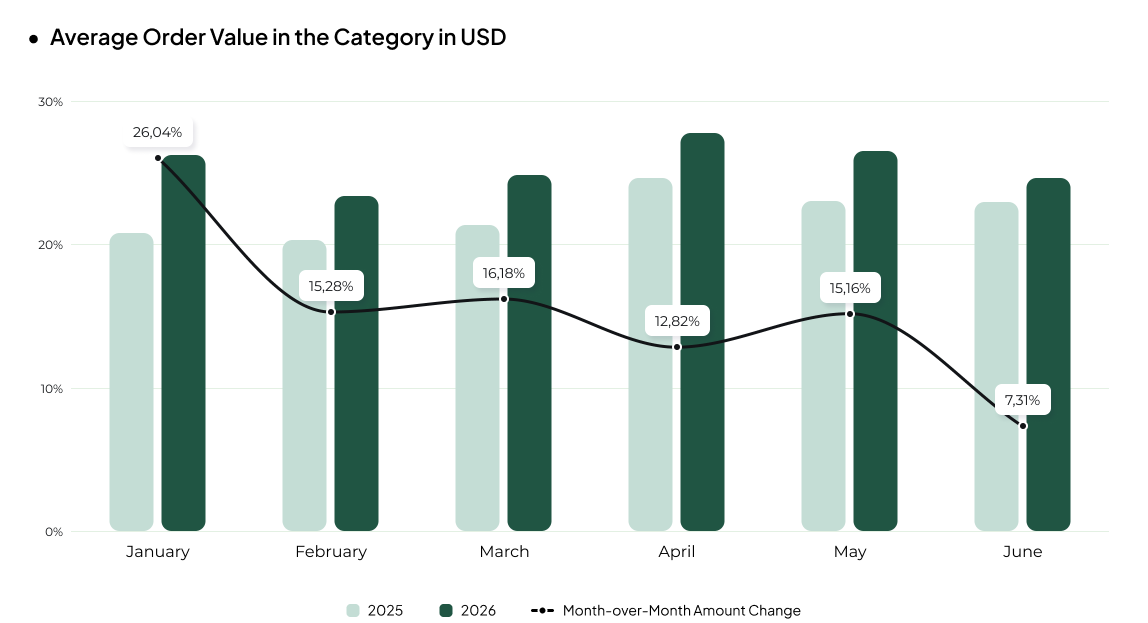
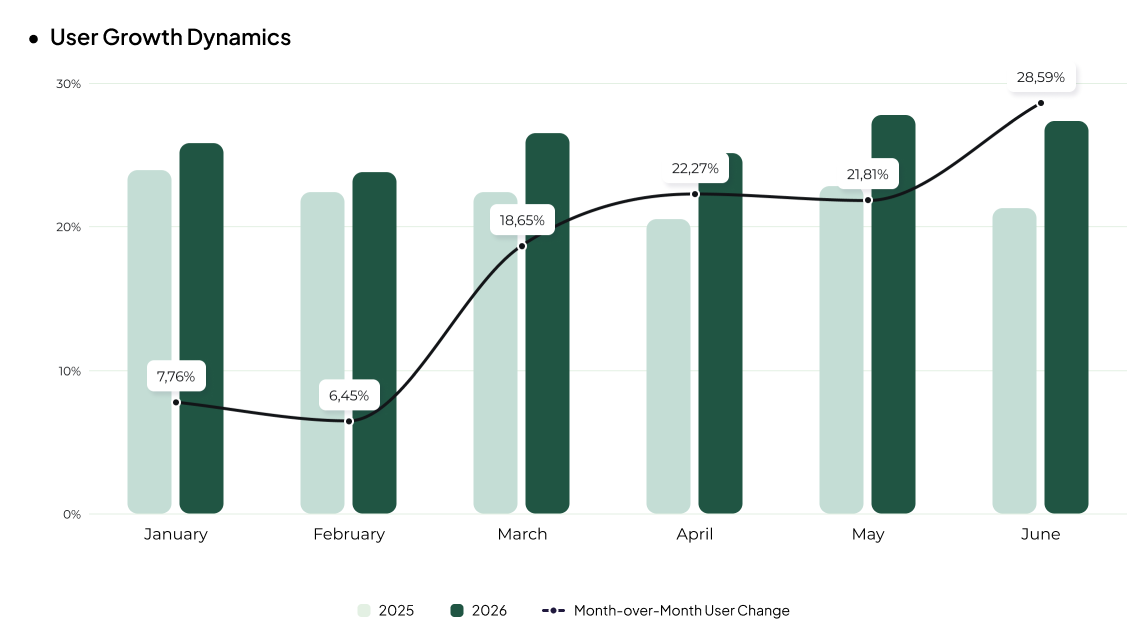
  • Order volume rose 25%, and average order value rose 25% in UAH (20% in USD). Orders grew faster than traffic, which was up 24%, while conversion rate improved by 1%. In other words, the category converted more orders without a proportional increase in audience size — traffic simply became more efficient. Part of the rise in average order value may be tied to price inflation: according to Counterpoint Research, global wholesale smartphone prices rose 14% in Q1 2026 while shipments fell 3.1% year-over-year. An iPhone shortage in Q4 2025 compounded this — official resellers received the new model with delays, and stock sold out within hours of each restock — keeping demand elevated into early 2026.
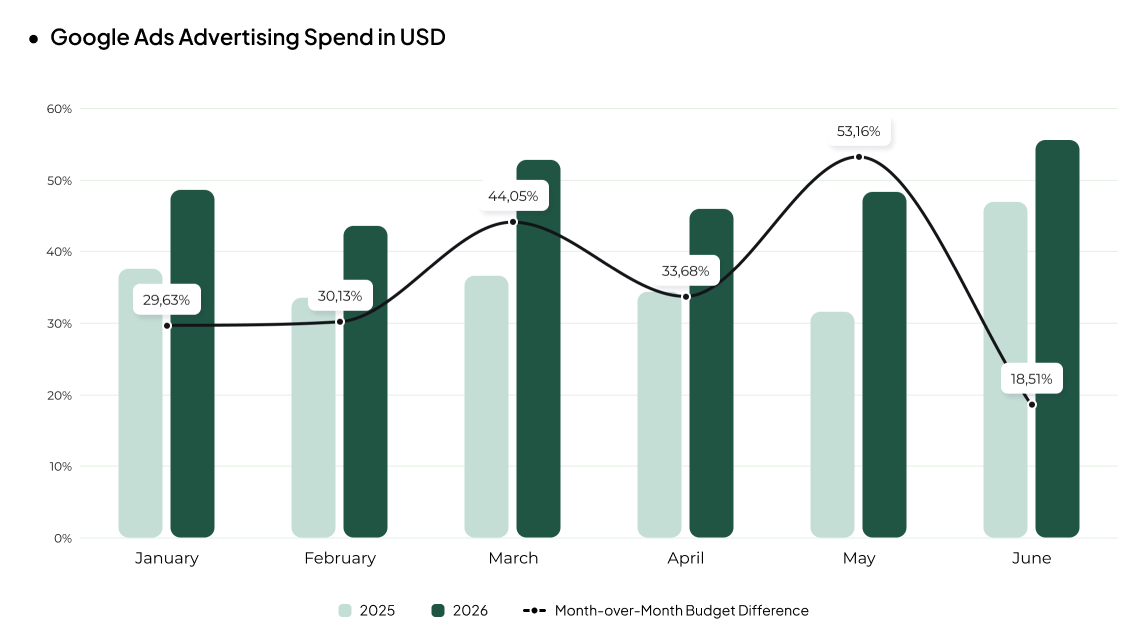
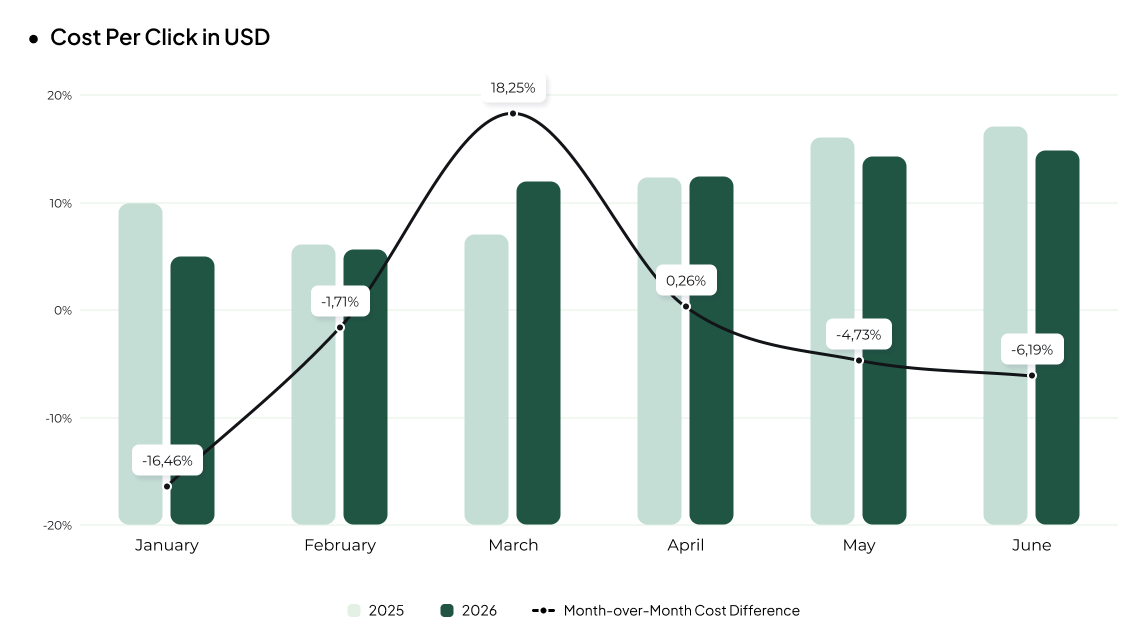
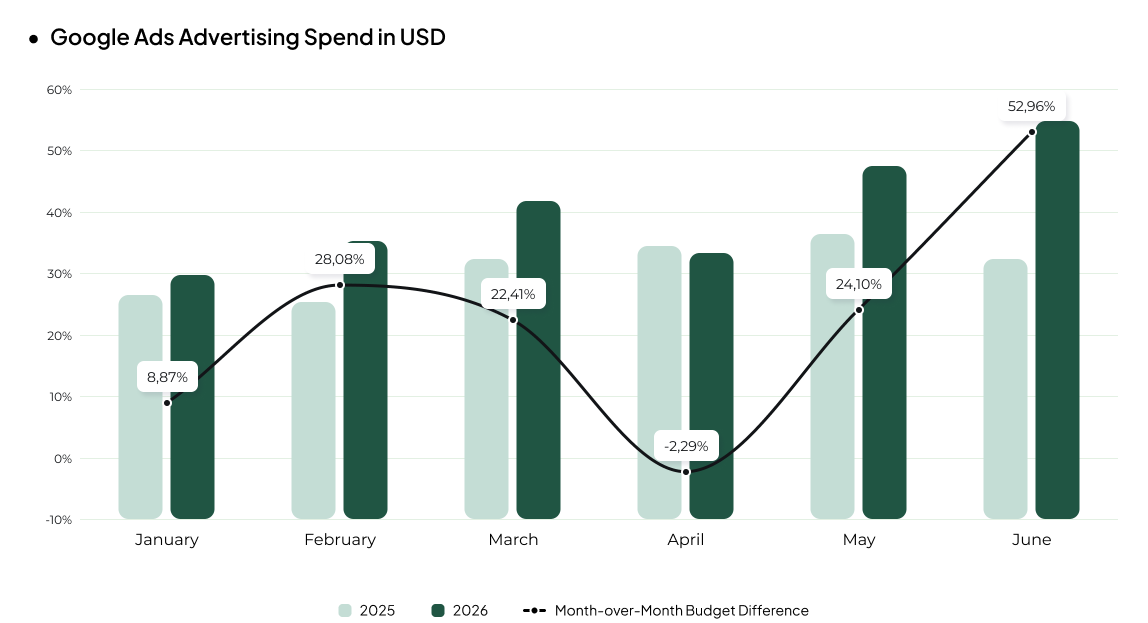
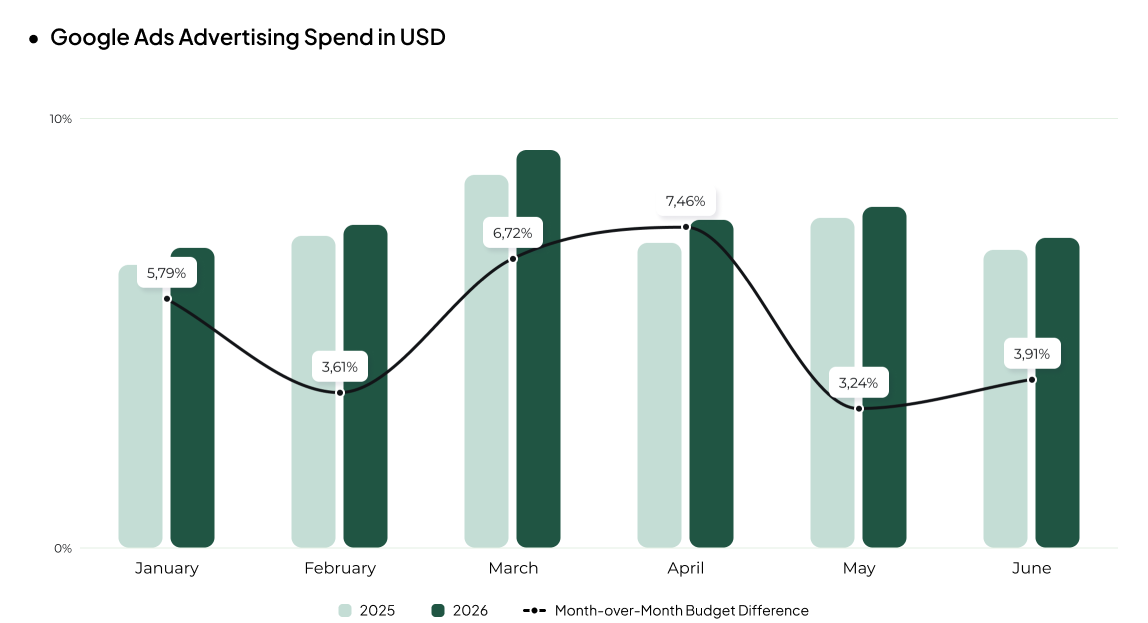
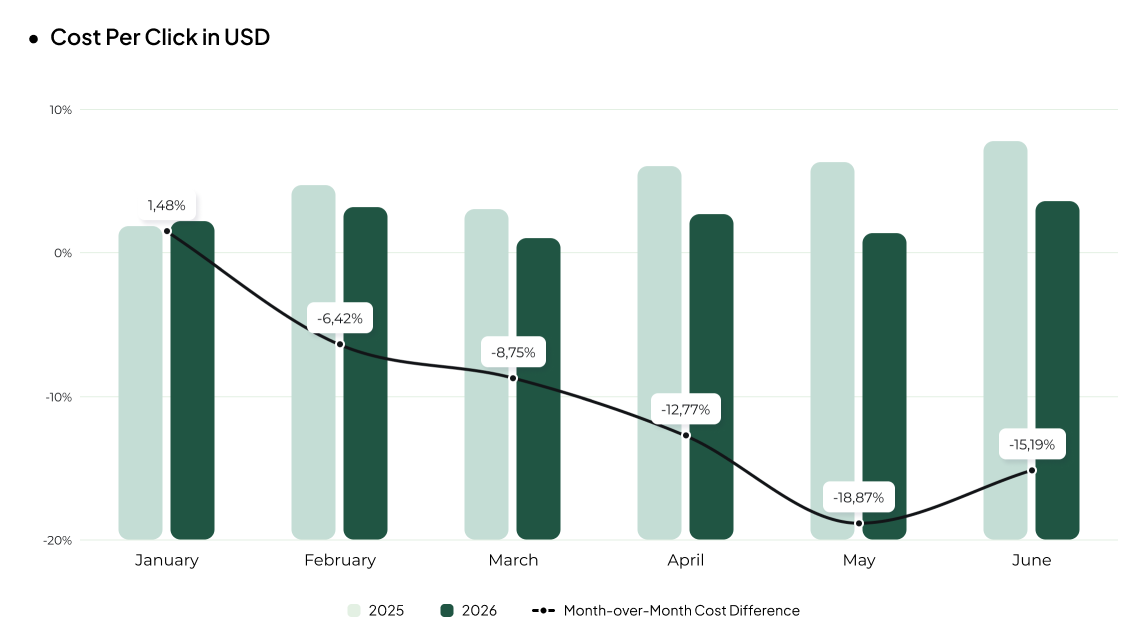
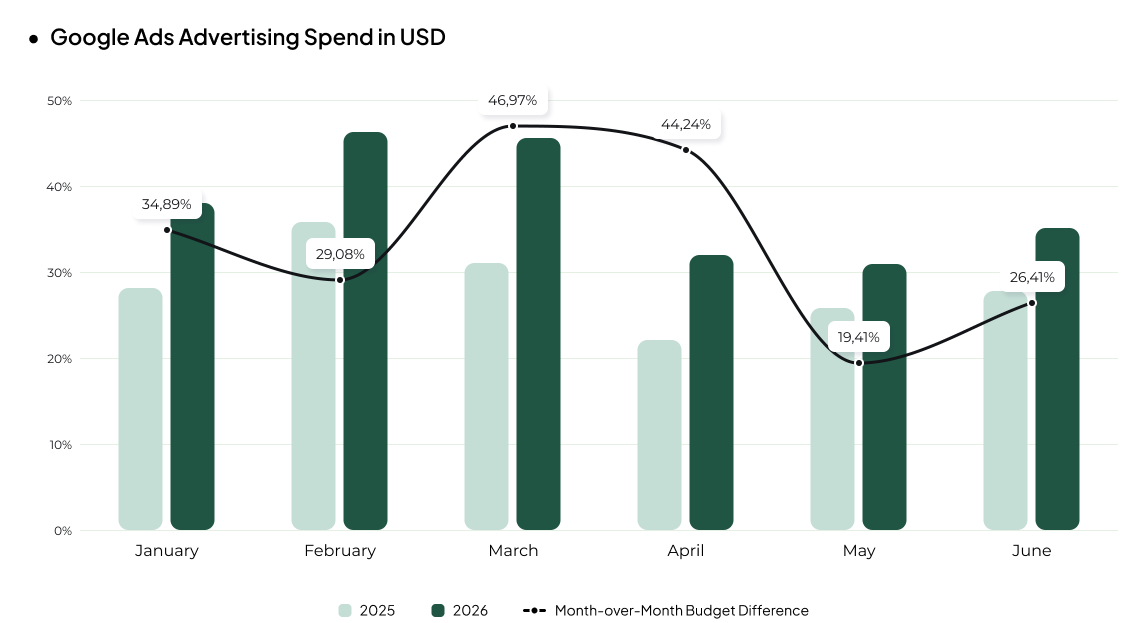
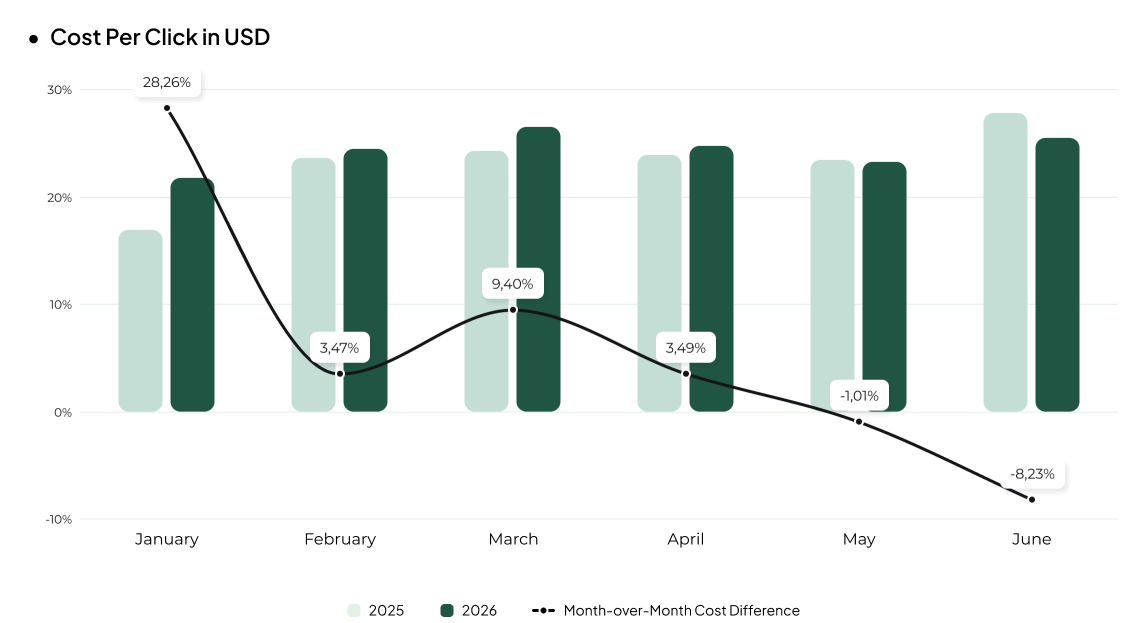
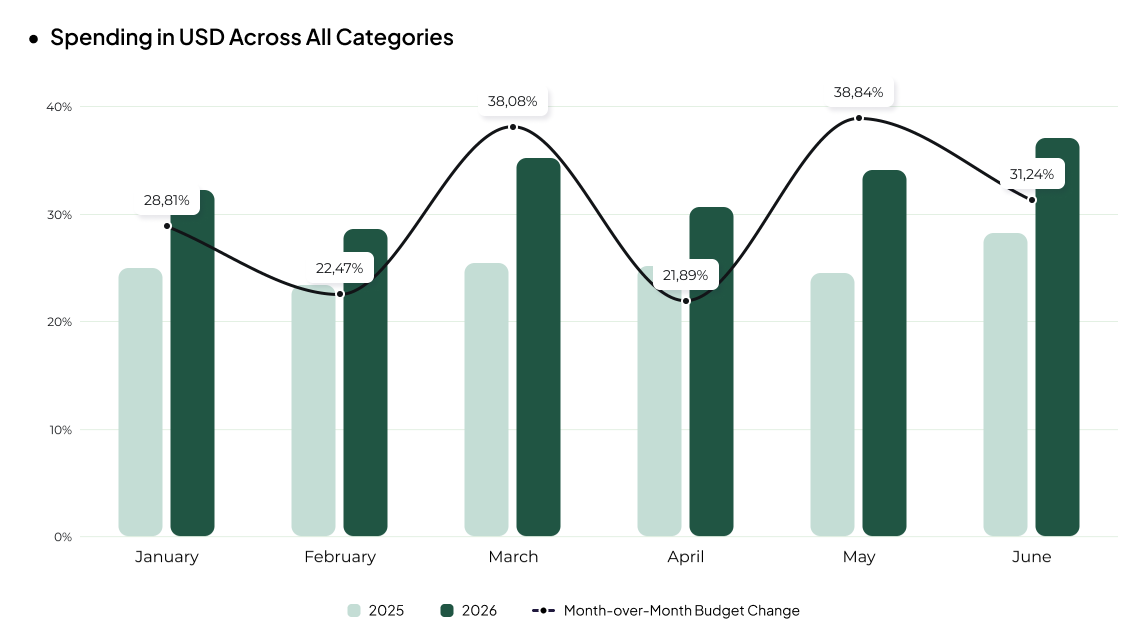
  • Ad spend rose 34% in USD, roughly tracking revenue growth. Cost per click actually fell 2% in USD — higher investment scaled traffic volume without a meaningful increase in acquisition cost. Ad spend stayed conservative early in the year due to the energy crisis, then scaled up as demand strengthened, with advertisers keeping a tight focus on ROI throughout.
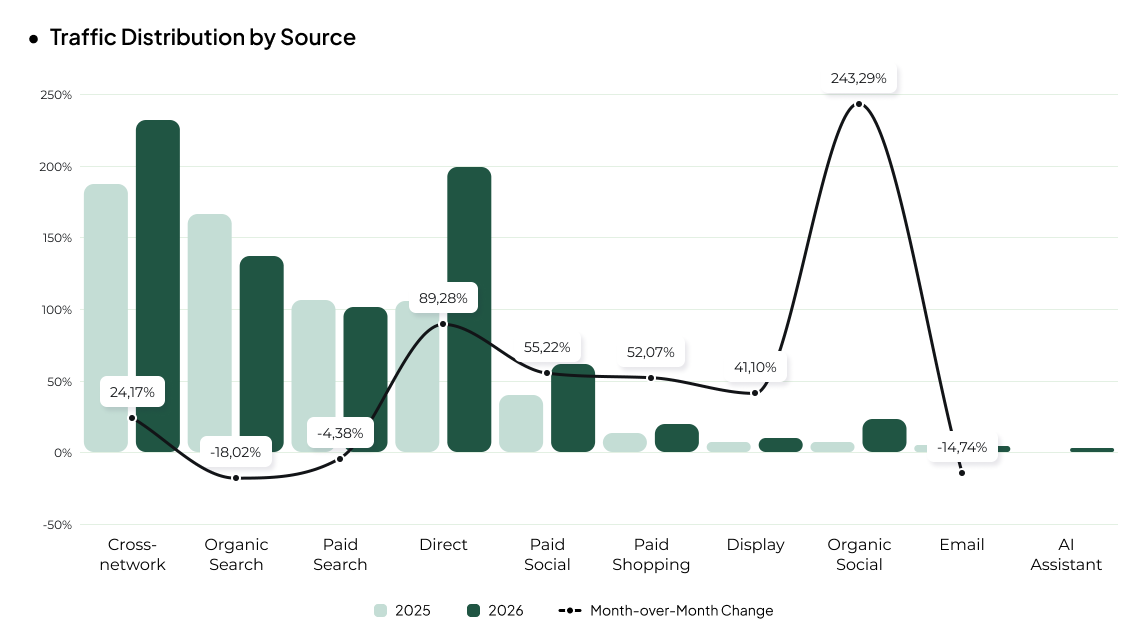
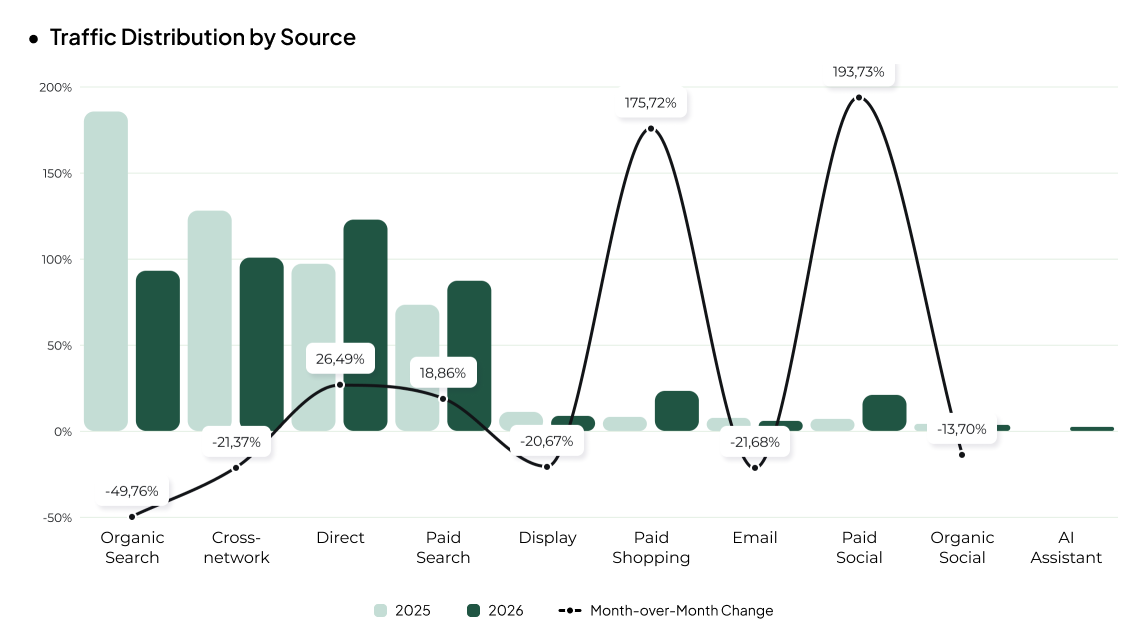
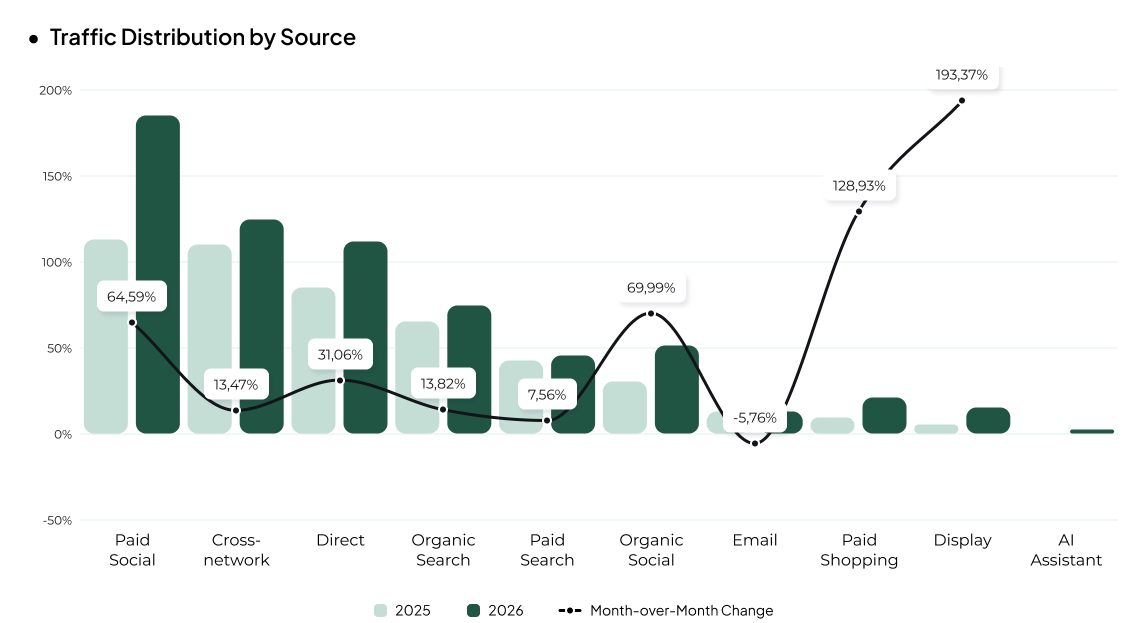
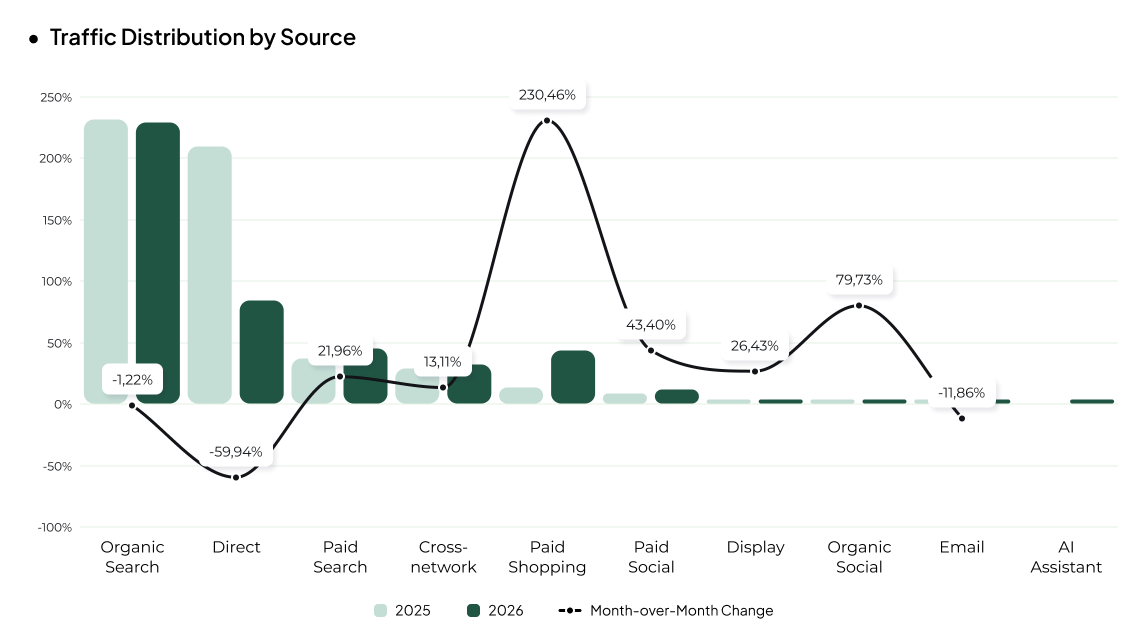
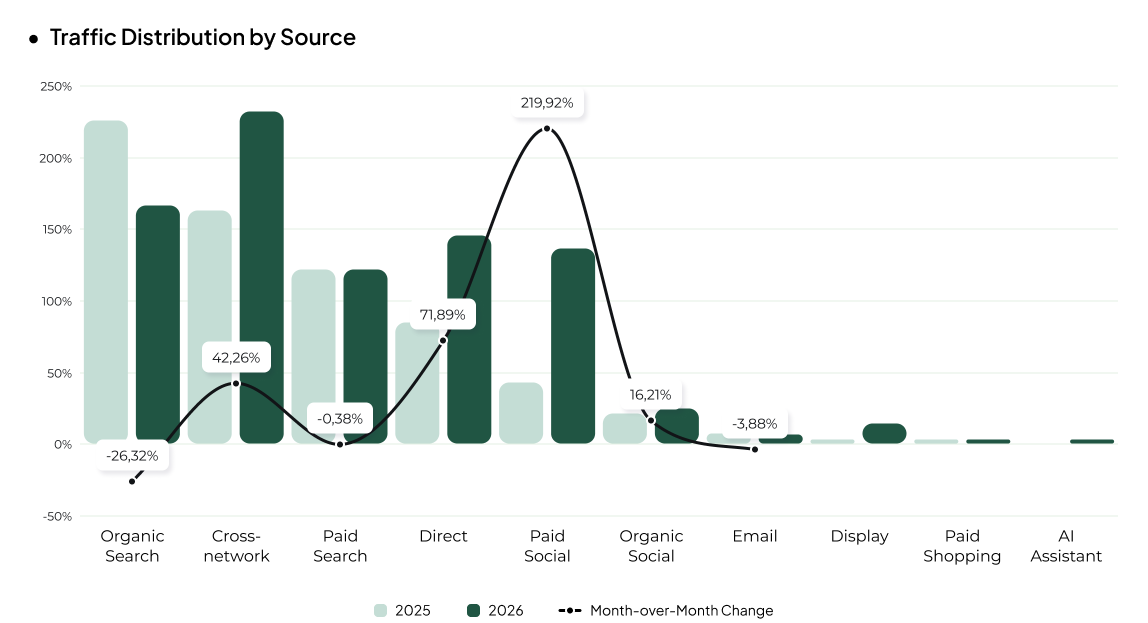
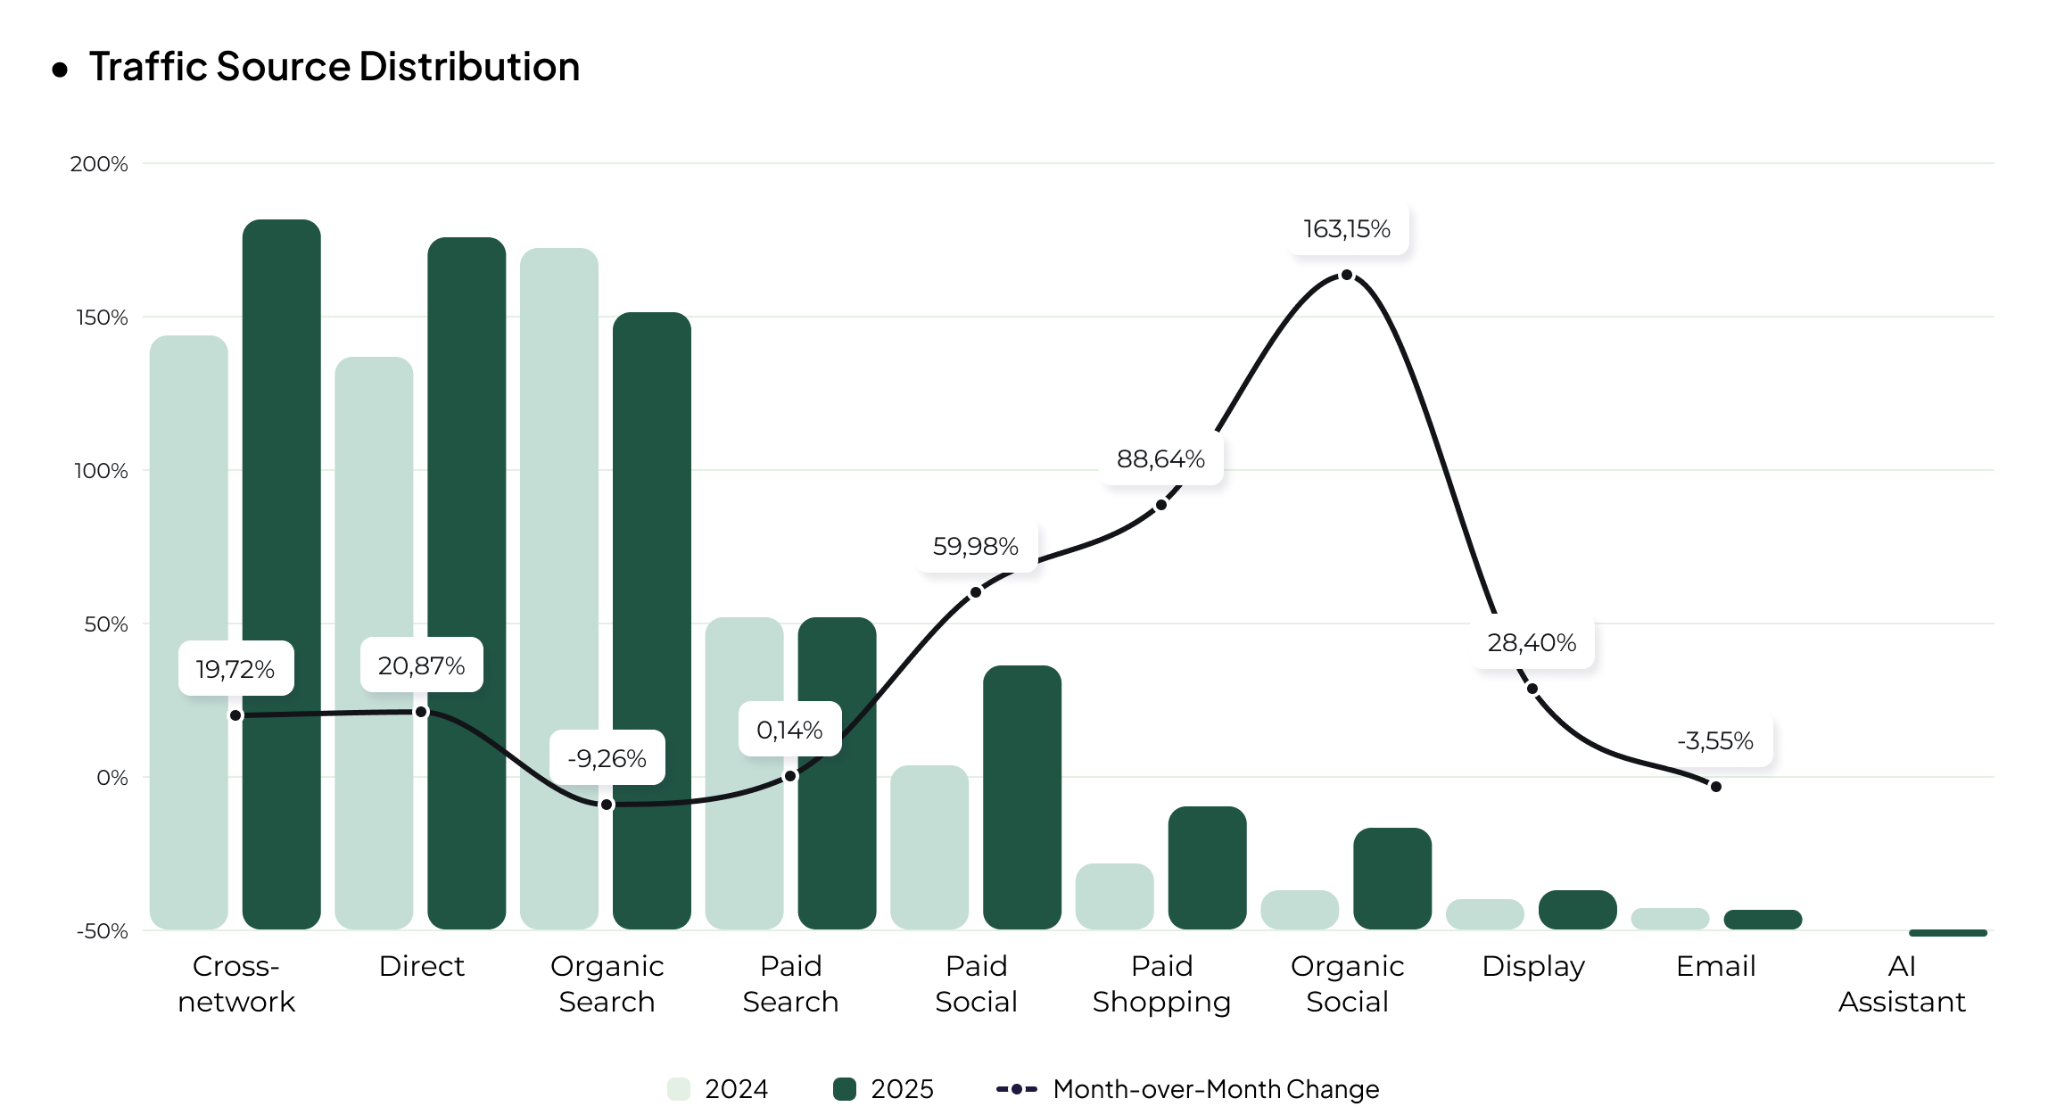
  • Campaign-type mix stayed largely stable half-over-half. Performance Max's share of channel spend grew 4 percentage points, while Search campaigns shrank by the same margin. As with the broader Ukrainian eCommerce market, Electronics is seeing rising AI-driven traffic — a mix of AI crawler activity and genuinely new product-discovery journeys through AI assistants — a channel that warrants close, ongoing monitoring.
  • Unlike the prior period, H1 2026 did not show the category's typical traffic drop-off after the seasonal demand peak. This likely reflects a pattern that took hold in 2025: large-scale power outages keep demand elevated for autonomous-power devices (power banks, charging stations), partially offsetting the usual seasonal slowdown.

Food & Beverage Niche in Ukraine in 2026

[[SLIDER-START]]

[[SLIDER-END]]

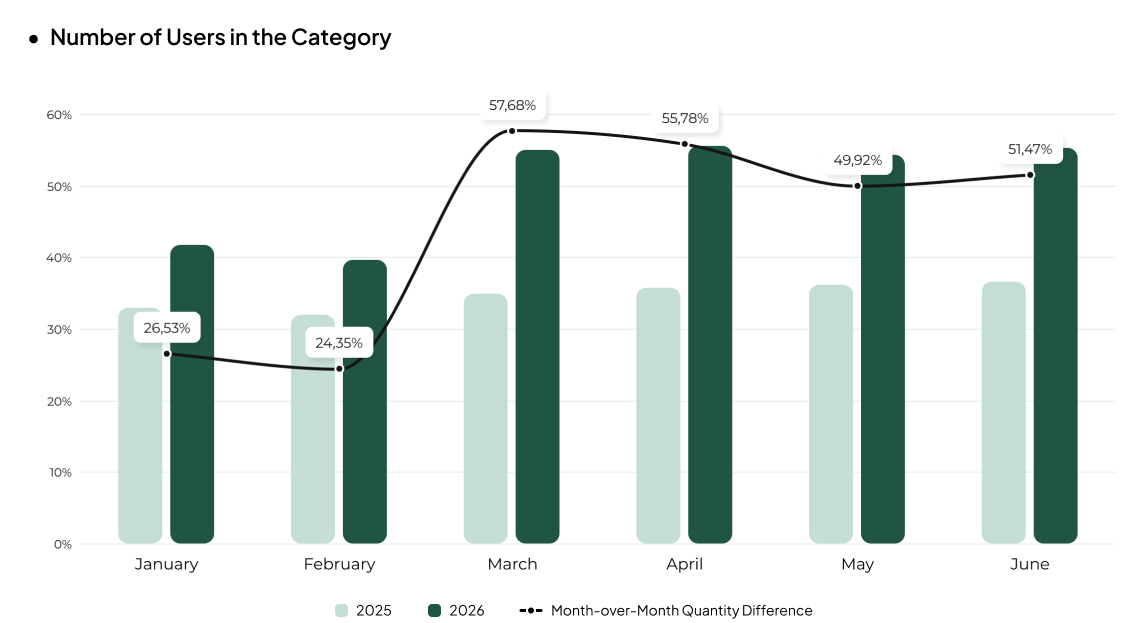
  • Online demand in Food & Beverage kept accelerating: traffic grew 49% in H1 2026 year-over-year, peaking at 58% growth in March. This builds on the prior period's 53% traffic growth and points to a deepening habit of buying groceries online and rising demand for delivery.
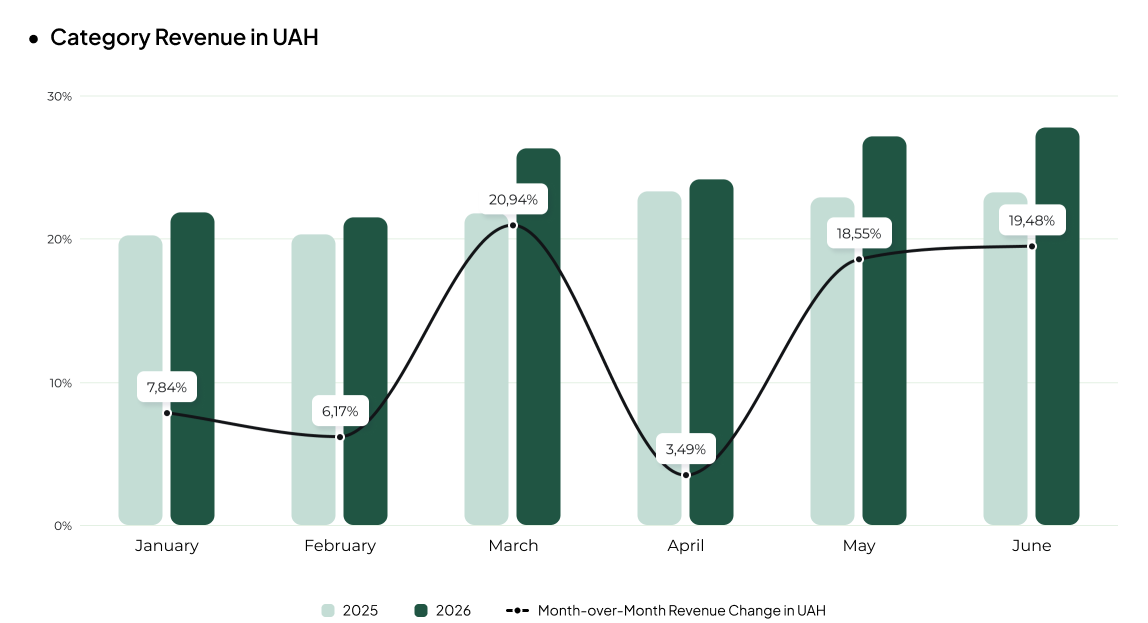
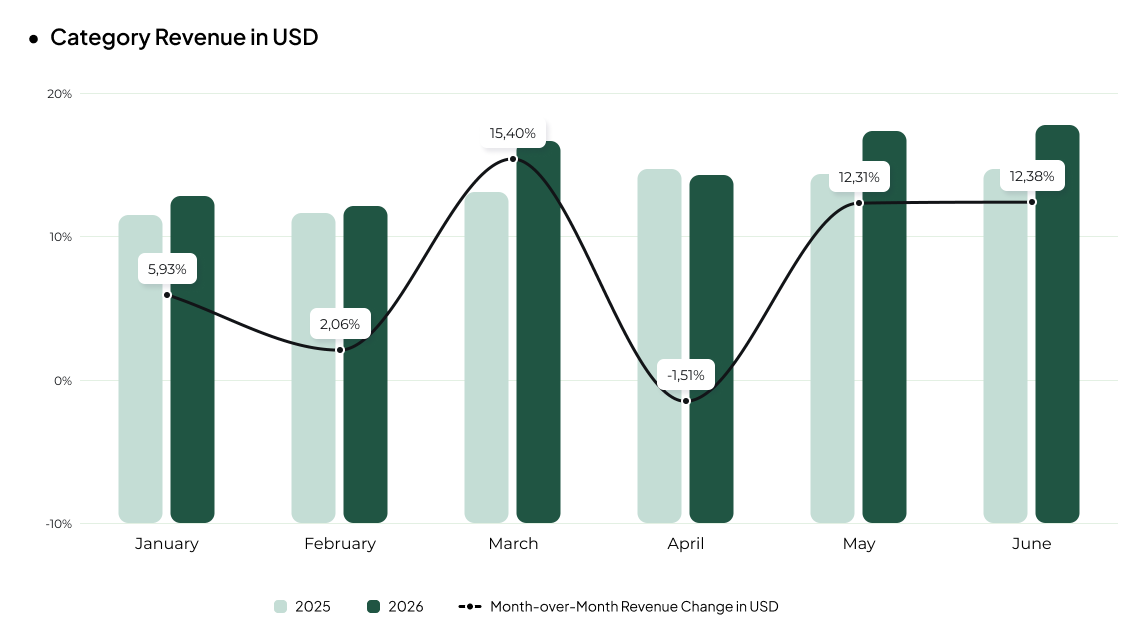
  • Order volume rose 18%, though growth has slowed compared to H2 2025. Revenue rose 22% in UAH (17% in USD), tracking traffic growth closely. This aligns with the broader Ukrainian alcohol market, where revenue rose 13.5% in UAH from January to May 2026.
  • Average order value barely moved: +4% in UAH, -1% in USD. As in the prior period, category growth is driven mainly by more visits and more orders — not by a higher order value.
  • At the same time, conversion rate fell 19% — traffic is growing significantly faster than orders. This may reflect audience expansion at the discovery stage: some new visitors are likely browsing assortment, comparing prices, or building future purchase intent without converting immediately. Scaling traffic further won't necessarily lift revenue proportionally without also improving traffic quality and conversion rate.
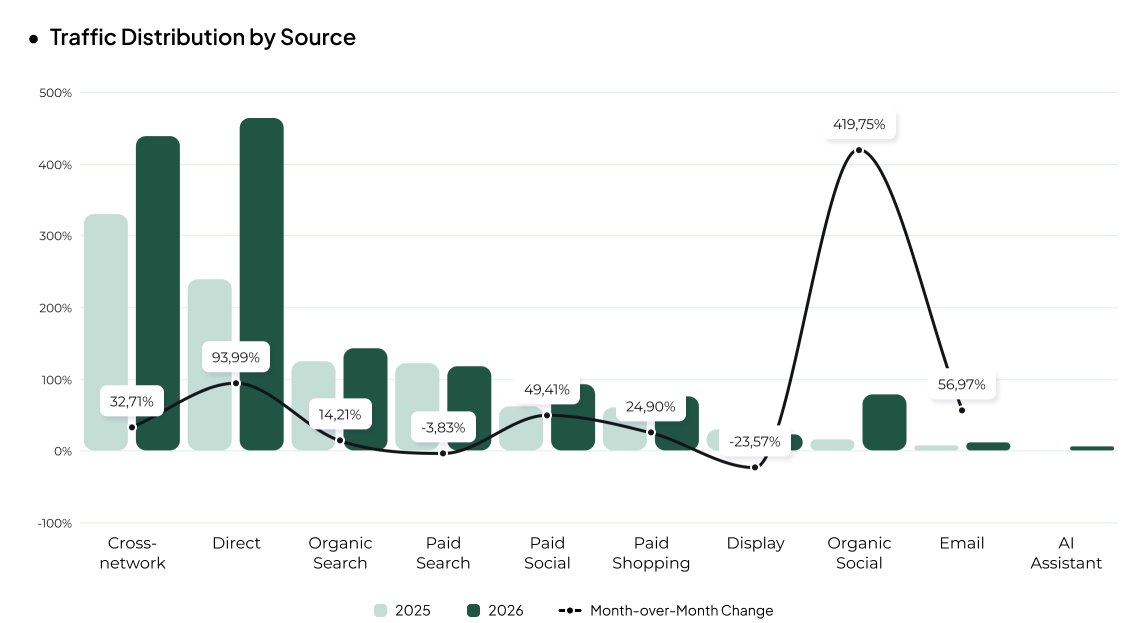
  • Within the traffic mix, organic search grew 14%, while paid search declined. Other major channels showed positive growth. A notable rise in Direct traffic may point to stronger repeat engagement and brand loyalty — though some AI-assistant referrals may also be misattributed to Direct due to lost referrer data, meaning AI's real contribution to traffic growth could be understated.
  • Overall, Food & Beverage keeps expanding its online footprint, but order growth is falling noticeably behind traffic growth. The key challenge for H2 won't just be growing the audience further — it'll be converting new visitors into actual orders.

Pet Care Segment in Ukraine 

[[SLIDER-START]]

[[SLIDER-END]]

  • Revenue continued its growth trend in H1 2026: +13% in UAH, +8% in USD, with the most notable spike in March (+20%). This period coincided with new regulations on the advertising and sale of veterinary products, which tightened advertising and remote-sales rules for certain products (without banning online sales outright) — likely reshaping demand patterns in the category.
  • Order volume rose just 2% — customers aren't buying meaningfully more often. Revenue growth came instead from average order value (+11% UAH / +6% USD). A 14% jump in average order value in March confirms the shift: customers bought more items per order, or spent more per order overall.
  • Traffic fell 13%, yet conversion rate rose 16%. This points to higher-quality traffic: fewer visitors are generating more orders, with returning customers driving the bulk of both visits and sales.
  • Ad spend rose an average of 22% in USD half-over-half. One likely driver: organic traffic in the category collapsed by nearly 50%, forcing businesses to compensate more aggressively with paid acquisition.
  • Organic traffic fell by almost 50%. Within the campaign mix, Shopping's share rose 8 percentage points while Search and Performance Max lost ground to product listing ads — confirming the broader category trend: businesses are offsetting lost organic reach by scaling paid, primarily Shopping-driven, acquisition.
  • The growth model itself has shifted: in H2 2025, growth was driven by more traffic and more frequent purchases; in H1 2026, it's driven by higher conversion rate, repeat purchases, and a bigger average order. Rising Direct traffic suggests a growing reliance on an established customer base, while new-customer acquisition remains limited.

Fashion & Apparel eCommerce in Ukraine

[[SLIDER-START]]

[[SLIDER-END]]

  • After a long stretch of decline, Fashion & Apparel is showing a trend reversal. Revenue rose 14% in UAH and 9% in USD versus H1 2025, with the strongest gains in May–June (+20% UAH, +12% USD). Adjusted for inflation, though, growth remains modest — this looks more like the category holding its ground than a genuine demand rebound.
  • Order volume rose 7%, with average order value up 6% in UAH (2% in USD). Traffic jumped 37%, but combined with a 22% drop in conversion rate, that signals declining traffic efficiency. Sales growth is being driven mainly by more visits, not a better conversion rate. Meanwhile, ad spend rose just 5% in USD, and cost per click actually fell 10%. Meta and Performance Max remain the two dominant paid channels — Meta as the primary first-touch channel for discovery, and Performance Max for scaling demand through automated acquisition.
  • A standout trend in H1 was a sharp spike in AI and bot traffic. Growth became especially visible from May onward, exceeding 200% year-over-year by June. We excluded bot activity from our traffic analysis for this category to avoid distorting the real audience growth figure.
  • Going into H2 2026, the impact of AI and bot activity on eCommerce traffic measurement remains an open question, dependent on both the phenomenon's evolution and the market's ability to detect and filter it. When evaluating channels and conversion rate, businesses need to weigh traffic quality — not just volume.
  • Sales keep growing, but order growth is lagging behind traffic growth, making traffic quality and conversion rate the key levers for further category growth. Globally, fashion retail is entering a more cautious consumption phase in 2026 — shoppers are more price-sensitive, and brands face growing pressure on demand, margin, and growth rate.

Pharmacy & Health Ecommerce Niche in Ukraine 

[[SLIDER-START]]

[[SLIDER-END]]

  • Pharmacy revenue rose 11% in UAH and 7% in USD in H1 2026. Year-over-year dynamics should be read in the context of new market and legal changes affecting how pharmacy players operate and what promotion tools are available — notably, updated regulations on the marketing and advertising of medicines, in effect since early 2026.
  • Order volume rose a modest 4%. Average order value rose 7% in UAH (2% in USD). This matches the broader pharmacy-market trend: revenue growth is driven mainly by a higher order value, not more units sold. The growth pattern itself has shifted — in H2 2025, order volume was the main revenue driver; now, average order value plays the bigger role.
  • This shift is happening against a backdrop of rising price sensitivity: according to research from the Center for Applied Research, price is the top barrier to medicine accessibility for 60% of Ukrainian consumers.
  • Category traffic fell 10%, but conversion rate rose 16%. Lower traffic volume is generating more orders — the audience has become more targeted and converts better.
  • Hypothesis: the decline in Direct traffic may reflect a change in how consumers search for pharmacy products. As price sensitivity grows and price-comparison tools become more accessible, shoppers may increasingly search for specific medications and better deals via search and other external channels, rather than navigating straight to a pharmacy's site.
  • Overall, Pharmacy keeps growing without audience expansion: the main revenue contribution comes from working existing traffic more efficiently and raising order value. Compared to late 2025, the category is shifting from a purchase-frequency growth model to one built on average order value and traffic quality. Because 2026's regulatory changes reshape the operating environment for every pharmacy player, current dynamics shouldn't be read as a straightforward continuation of the previous trend.

Jewelry eCommerce Segment in Ukraine 

[[SLIDER-START]]

[[SLIDER-END]]

  • Jewelry revenue rose 14% in UAH and 9% in USD, though growth slowed over the course of the half. The category grew through January–April, then noticeably weakened from May onward. One likely factor is the global rise in precious-metal prices, which directly affects finished jewelry costs: gold's benchmark price in Ukraine jumped from ₴5,800/gram in early January to over ₴7,100/gram by late February.
  • Early in the year is traditionally an important gifting period for the category — Valentine's Day and March 8 (International Women's Day), which continues to drive consumer demand despite its shifting cultural status. This supported demand in early 2026, but May's Mother's Day didn't produce a comparable boost. This may point to a reshuffling of gift-spending priorities, with some budget shifting to categories like Consumer Electronics, which may be competing for the same higher-ticket gift spend.
  • Order volume fell 6%, while average order value rose 21% in UAH (15% in USD). Positive revenue growth is being propped up almost entirely by a higher order value offsetting the drop in order count — a different pattern from H2 2025, when both average order value and order volume rose together.
  • Traffic rose 24%, but conversion rate fell 24%. Traffic growth didn't translate into more orders — more people visited, but fewer completed a purchase. The first signs of declining order volume appeared in April, and revenue growth started slowing from May as well.
  • Google Ads investment rose 33% in USD, and cost per click rose 7%. Organic search's share fell 26 percentage points, while paid social grew — signaling a shift in traffic mix toward paid channels.
  • Hypothesis: rising Direct traffic may reflect a more deliberate purchase journey — given jewelry's high price point, shoppers may be more likely to return to familiar brands and sites after researching and comparing options elsewhere first.
  • The category is entering a more cautious growth phase: buyers are becoming more price-sensitive to jewelry, and businesses need new ways to sustain demand and acquisition efficiency.

The State of Automotive Parts Segment in Ukraine

[[SLIDER-START]]

[[SLIDER-END]]

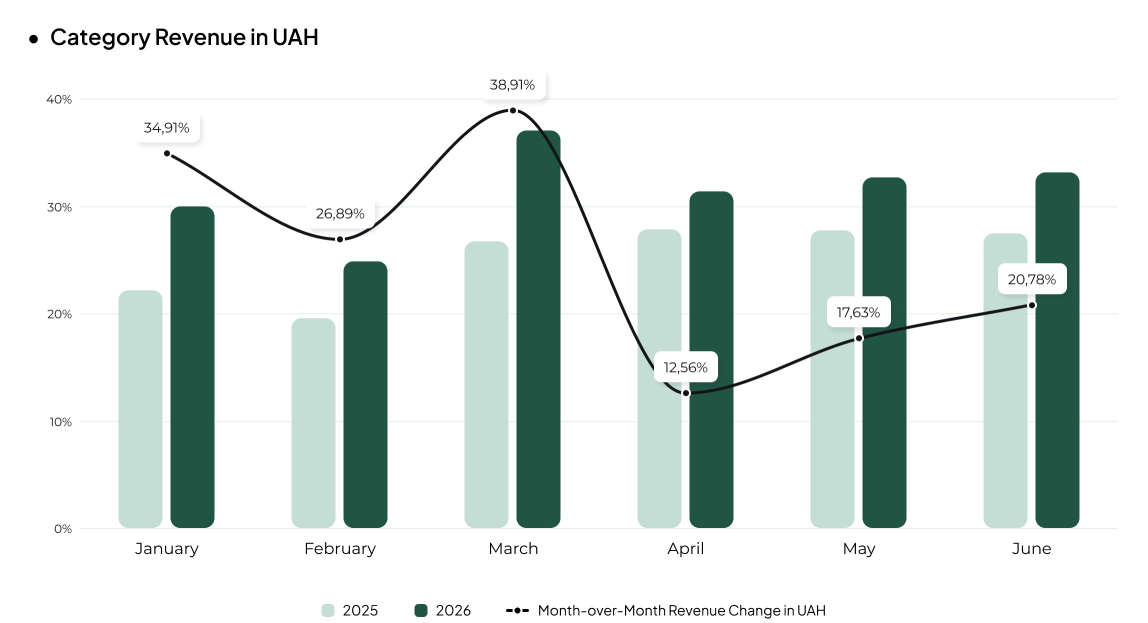
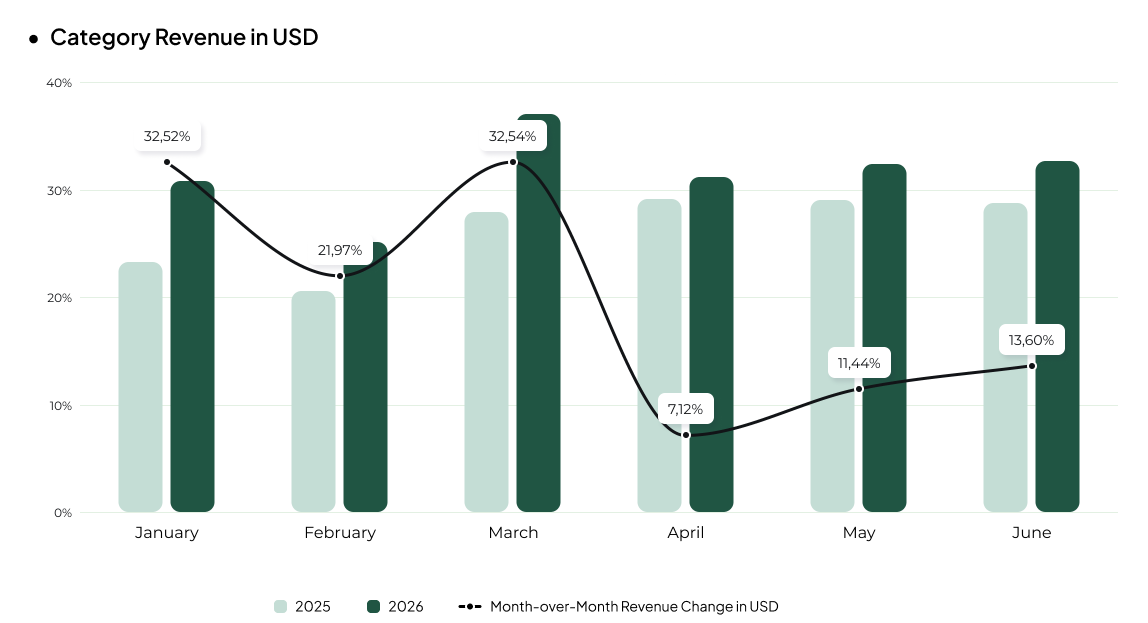
  • Automotive Parts kept growing: H1 2026 revenue rose 25% in UAH and 19% in USD versus H1 2025 — faster than the prior half, meaning growth is accelerating.
  • The strongest gain came in March, with revenue up 39%. One likely factor: pent-up demand after a difficult 2025–2026 winter — poor road conditions drove tire-service demand up 4–5x, along with demand for replacement tires and rims. Ukraine's used- and new-car markets also rebounded sharply after the winter slowdown: the domestic used-car market grew 17.2% and used-car imports rose 18.2% by February, while new-car imports rose 26.8%. This likely reinforced the category's March peak.
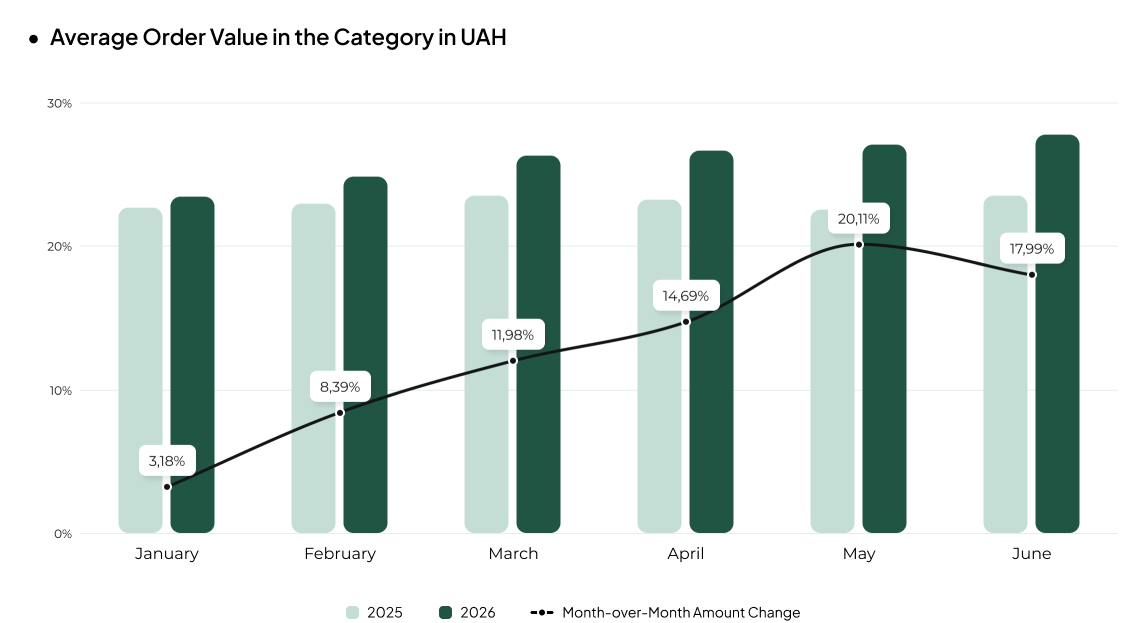
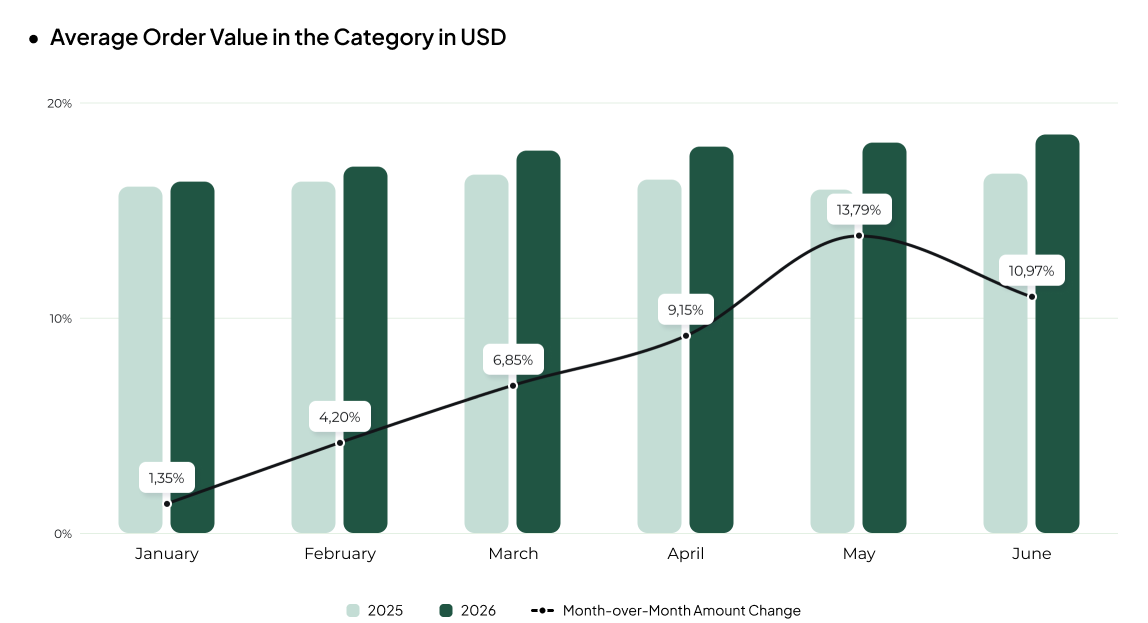
  • Order volume also rose 11%, with average order value up 13% in UAH (8% in USD). Customers bought more often and chose pricier items per order. Power outages may have added another demand driver: the energy crisis kept demand elevated for car batteries, used both to run vehicles and as backup power sources.
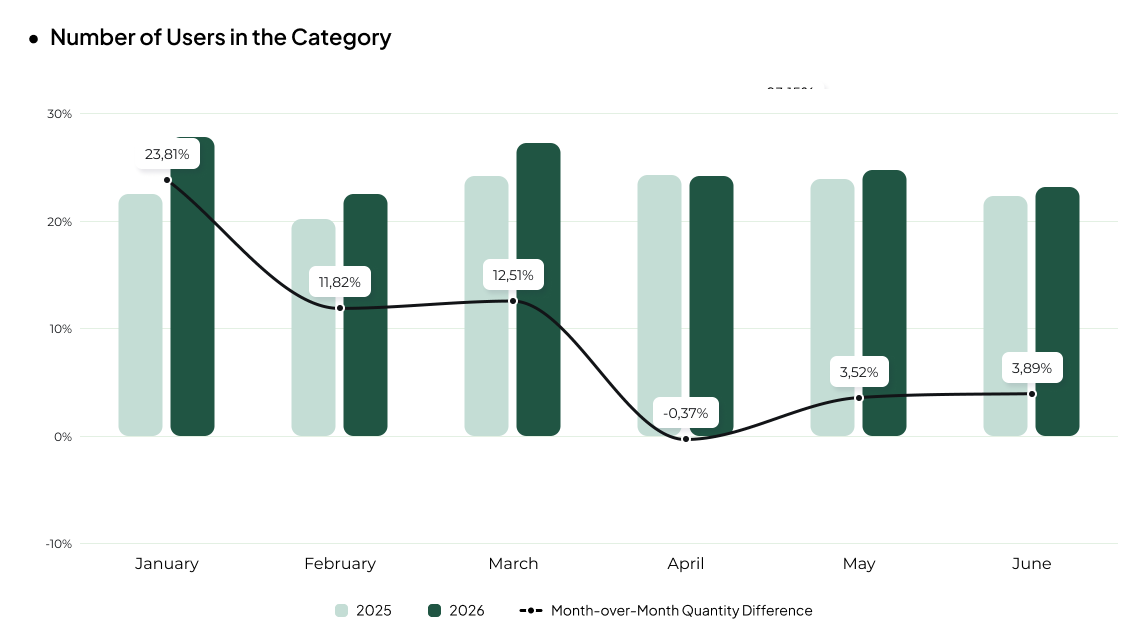
  • Unlike the prior period, traffic rose 9% alongside a 2-point improvement in conversion rate — signaling both a larger interested audience and consistently high traffic quality.
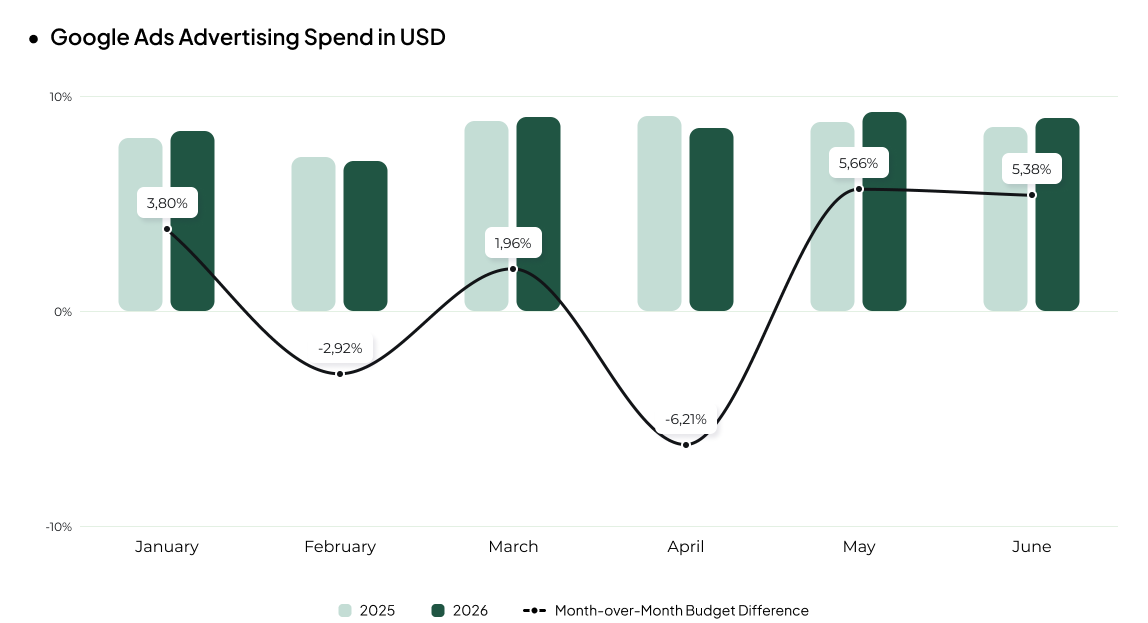
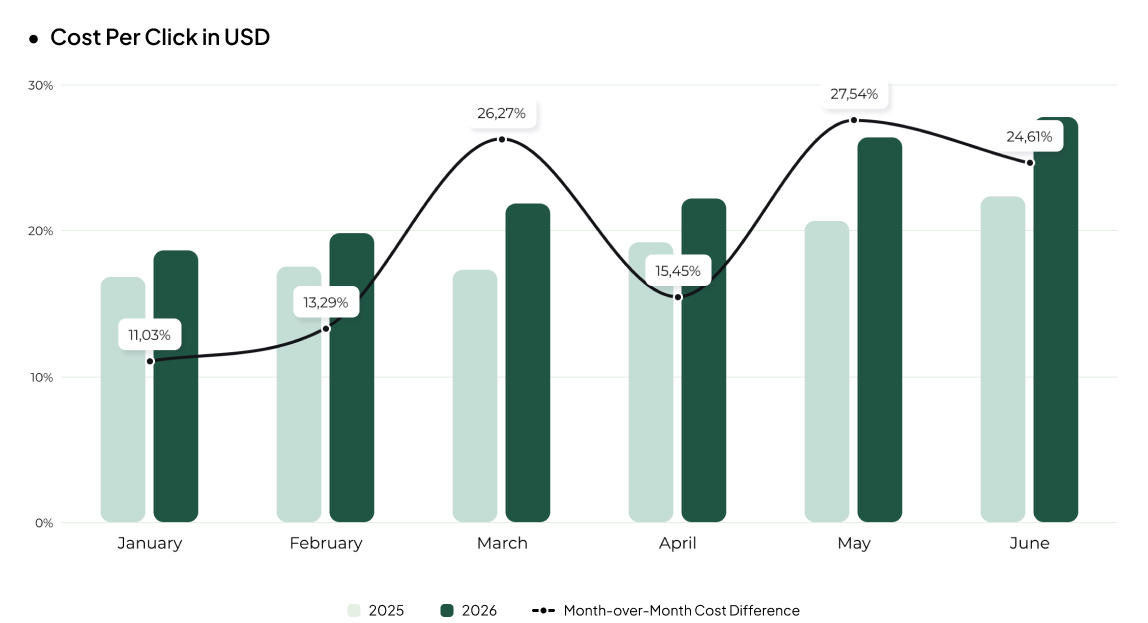
  • Ad spend rose just 1% in USD, while cost per click rose 20%. Even so, this let businesses scale customer acquisition efficiently without meaningfully bigger budgets. 2026 saw a shift in seasonal demand: an unusually warm March pulled the category's seasonal peak forward. Part of the seasonal demand and ad investment that would normally land later shifted into March, likely explaining softer category performance in April–June.
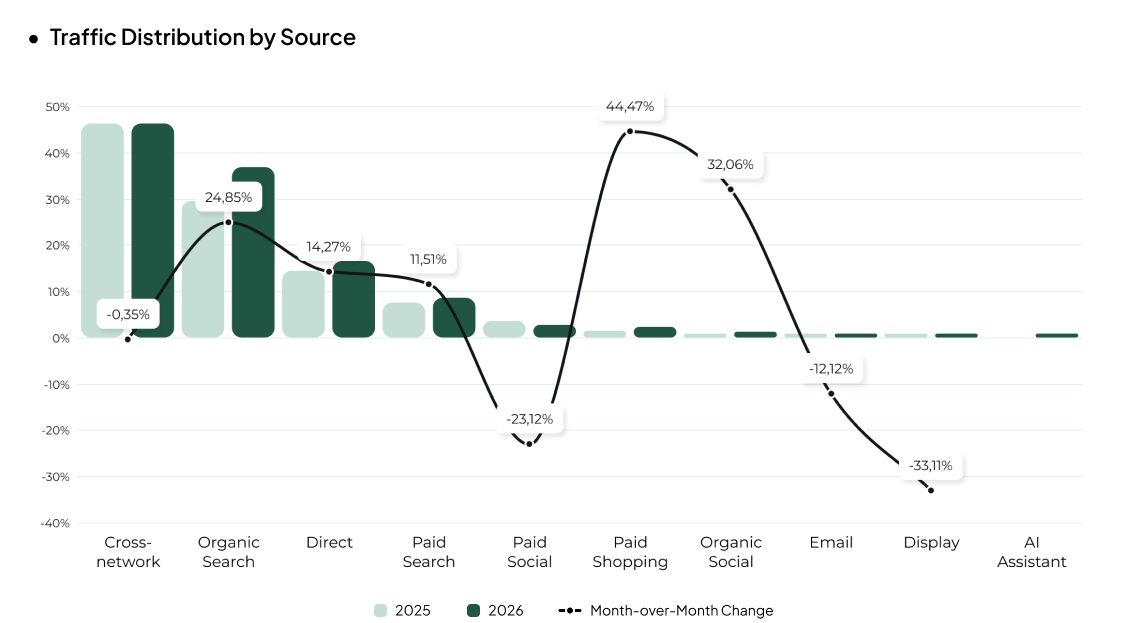
  • Traffic-source mix stayed largely unchanged, with Direct still holding a high share — confirming a well-established core of loyal, brand-aware customers.
  • Overall, the category grew on the back of more total visits, more efficient traffic, and a higher average order value.

Overall Conclusions & Ukraine eCommerce Forecast for H2 2026

[[SLIDER-START]]

[[SLIDER-END]]

Ukraine's eCommerce market keeps growing despite the war and ongoing attacks. Revenue rose across most categories in H1 2026, and in several niches growth outpaced H2 2025. At the same time, order volume growth is slowing, and average order value is becoming one of the key revenue drivers.

Online shopping is becoming a routine part of Ukrainian consumer behavior. According to Gradus, 56% of Ukrainians shop online at least a few times a month, and 19% shop weekly. The share of regular online shoppers is growing 4–5 percentage points a year — meaning further eCommerce growth will increasingly hinge not just on new customer acquisition, but on the frequency and repeat-purchase behavior of the existing audience.

Traffic quality is becoming more important than traffic volume. In several categories, conversion rate is rising even as the audience shrinks, and order volume is growing faster than traffic. Businesses need to focus less on raw traffic growth and more on attracting higher-intent users and working existing demand more effectively.

H1 2026 shows a clear decline in organic traffic. Organic volume fell in four of seven categories (Electronics, Pet Care, Pharmacy, Jewelry). One likely factor is the expansion of Google's AI features, which increasingly answer user queries directly in search results without a click-through. Organic search is no longer a channel whose growth can be reliably projected from past trends alone — a shift also reflected in the growing conversation around GEO / Generative Engine Optimization.

AI and bot traffic are rising simultaneously. Volume began climbing sharply from May, and by June, growth in the Fashion & Apparel category exceeded 200%. Other categories also show unusually high Direct-traffic growth. This activity can distort both traffic and conversion-rate metrics, which is why we excluded bot traffic from our analysis. We'll continue tracking this factor in future reports and adapting our methodology as needed. For businesses, this means shifting from measuring traffic volume to measuring traffic quality and its real contribution to revenue.

Owned channels are becoming more important for customer retention. In several categories, revenue growth is fueled by repeat purchases and existing customers even as new-user counts shrink. Apps, loyalty programs, and personalized communication — including push notifications — let brands re-engage customers through owned channels without paying for every touchpoint through ad platforms. For high-repeat-purchase categories, this can be a materially more cost-effective retention model.

BNPL is evolving from a payment method into a competitive edge. A single 20-installment BNPL promotion on Apple products by a Ukrainian monobank generated ₴1.42 billion in sales and over 47,000 orders in just three days. The effect spread beyond the platform itself, lifting demand for Apple products broadly, as shoppers took advantage of similar offers elsewhere. This confirms that payment terms themselves can become part of the value proposition — and drive a serious commercial result.

H2 2026 will be a harder test for Ukrainian eCommerce. It covers the industry's peak selling season — Black Friday and the pre-holiday period — when consumer activity traditionally spikes. Escalating missile and drone attacks, strikes on logistics and warehouse infrastructure, and power-supply disruptions could all significantly affect business operations.

In other words, the challenge in H2 likely won't be a lack of willing buyers — it'll be businesses having enough to sell. The outcome of the year's peak selling season will depend heavily on the situation at the front, the stability of the power grid, and businesses' ability to secure inventory and logistics.

Grow Your eCommerce Business in Ukraine — or Anywhere Else

Behind every Promodo research report is hands-on experience running growth for dozens of eCommerce brands. If you're building a strategy to lead your category — in Ukraine or in any market — our team can help you turn these insights into a plan.

Looking to scale your eCommerce business and stay ahead of the competition?
Promodo helps brands turn growth opportunities into measurable business results with comprehensive marketing solutions.


FAQ: Ukraine eCommerce Market 2026

[[FAQ-START]]

Is Ukraine's eCommerce market still growing despite the war? 

Yes. Revenue grew year-over-year in six of the seven major categories Promodo tracked in H1 2026, despite the most severe wartime energy crisis to date and continued attacks on infrastructure.

Which eCommerce category is growing fastest in Ukraine in 2026? 

Consumer Electronics posted the strongest growth in H1 2026, with revenue up 56% in UAH (50% in USD), driven largely by demand for laptops and power banks amid blackouts and a large BNPL promotion on Apple products.

How has Ukraine's energy crisis affected online shopping behavior? 

Power outages have directly boosted demand in specific categories — portable power stations, power banks, and laptops in Electronics, and car batteries used for backup power in Automotive Parts — while also increasing overall business uncertainty and caution around ad spend and planning.

What percentage of Ukrainians shop online regularly? 

According to Gradus, 56% of Ukrainians shop online at least a few times a month, and 19% shop weekly, with the share of regular online shoppers growing 4–5 percentage points per year.

How is AI traffic affecting Ukraine eCommerce analytics in 2026? 

AI crawler and bot traffic rose sharply in 2026 — over 200% year-over-year in Fashion & Apparel by June — and is distorting standard traffic and conversion-rate metrics. This is pushing Ukrainian retailers toward traffic-quality analysis and GEO (Generative Engine Optimization) rather than raw traffic-volume tracking.

What should eCommerce businesses expect in Ukraine for H2 2026? 

H2 2026 covers Ukraine's peak selling season (Black Friday and pre-holiday demand) under continued security and energy risk. The key challenge is expected to be maintaining inventory and logistics reliability, not a lack of consumer demand.

[[FAQ-END]]

Written by
Hanna Sytnyk

Marketing Specialist at Promodo

I have been working in marketing since 2012 with an emphasis on market research and analytics. I am experienced in the following niches: food wholesale, insurance, real estate, and software distribution. I have been responsible for Promodo's cases since 2021. Doing marketing research, I focus on causes and effects, as well as measurable results.

Published:
August 20, 2026
Updated:
Subscribe to our newsletter
This is some text inside of a div block.
Thank you! Your submission has been received!
Oops! Something went wrong while submitting the form.
List of the US Trust worthy Automotive Forums
DOWNLOAD

You may also like

Check our similar articles

Choose quality and trusted services to improve the presence of your company on the Internet, and feel free to contact our UK team if you have any questions.

Boost Your Effectiveness

We at Promodo are ready to help you improve your performance across all digital marketing channels.

Get started
Contact us
Get a free strategy session

Let us look at your business challenge from a different angle and share our ideas.

Valid number
Send message

By clicking on “Send message” button, you agree to our Privacy Policy, and allow Promodo to use this information for marketing purposes.

Please check your inbox for a new email containing a list of reputable automotive forums.
Got it
Oops! Something went wrong while submitting the form.