
Content


Team Lead of Content for promodo.com
Experienced in working with data, expert recommendations, and real business cases to create clear and valuable content that delivers real business impact. Passionate about discovering new insights, exploring industry trends, and turning complex topics into practical, easy-to-understand content.

The average eCommerce conversion rate is 2.69%, and searching for growth opportunities is one of the main priorities for UX designers. During CRO research, teams generate dozens of hypotheses. However, when resources are limited, the key challenge becomes prioritization: which changes will deliver the greatest impact in the shortest time?
To address this challenge, Promodo's UX/UI experts use an adapted RICE model. It helps evaluate the potential impact of CRO hypotheses on conversion rates and allocate resources more effectively. In this article, we'll explore the team's UX strategy framework model and review practical examples of how it works in real projects.
+41% year-over-year conversion growth is the average result achieved by Promodo clients after implementing CRO recommendations. Discover the hidden growth opportunities within your sales funnel and identify the changes that can generate the fastest impact.
Conversion rate optimization starts with the CRO Discovery phase, which helps uncover real barriers preventing users from completing a purchase and identify growth opportunities. Effective CRO hypotheses are always grounded in comprehensive user behavior research.
At Promodo, we rely on the following methodologies:
As a result of this research, the team gains actionable, data-backed insights: where users drop off, which interface elements create friction, what prevents customers from completing purchases, and which improvements can enhance the user experience. These findings become the foundation for CRO hypotheses that are later tested and validated.

Following a CRO audit, teams typically end up with an extensive list of potential improvements. Since resources are always finite, an important question arises: which changes should be implemented first?
To objectively assess the potential impact of each hypothesis, Promodo's UX/UI specialists use an adapted version of the RICE prioritization framework.
Find 12 Common Paid Ads Mistakes That Kill Conversions
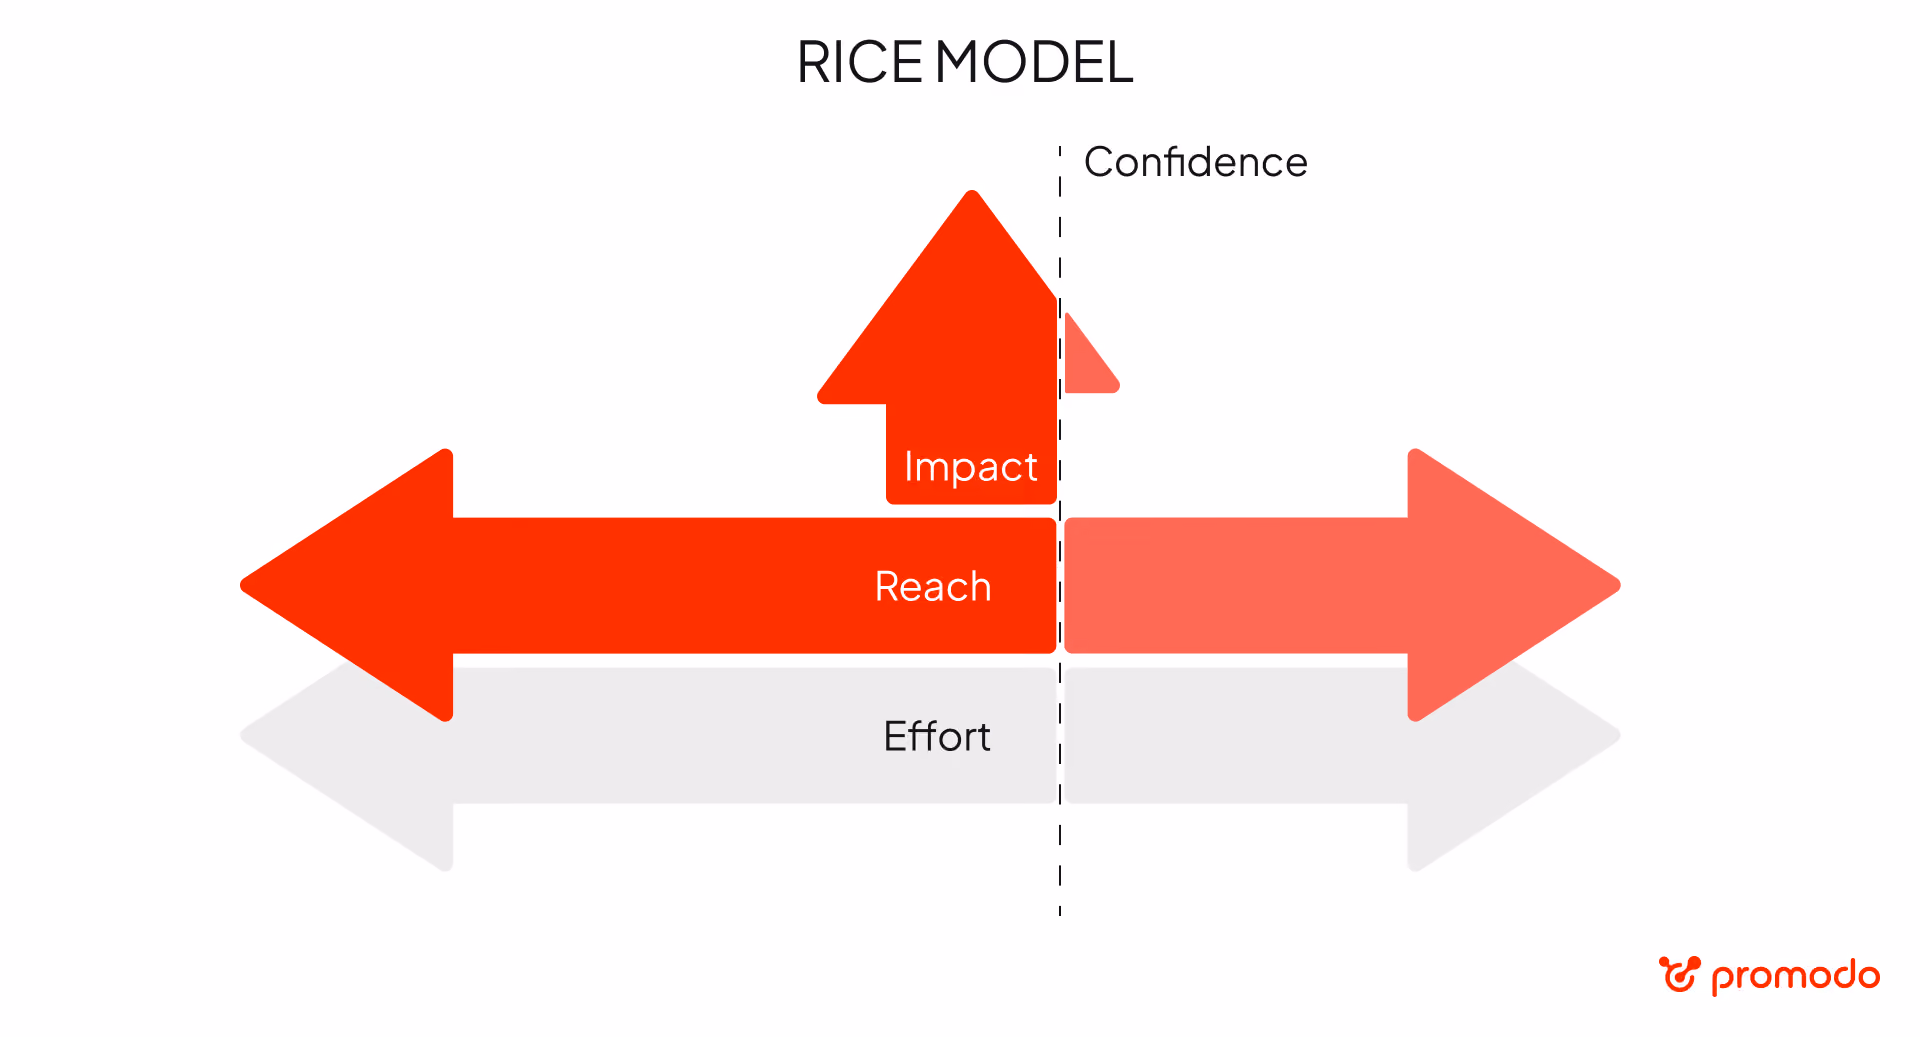
The classic RICE framework is a prioritization model widely used in product management. It evaluates initiatives across four dimensions:
We adopted this framework and its four core parameters as the foundation for UX feature prioritization, tailoring the methodology specifically for conversion optimization projects.
Here's what this approach looks like in practice.
To apply the RICE prioritization UI, each CRO hypothesis or UX/UI improvement is assessed across four parameters: Reach, Impact, Confidence, and Effort. Based on these inputs, a final score is calculated using a formula that helps prioritize implementation and focus on the most valuable changes first.
The first factor we analyze is how many users will potentially be impacted by a given hypothesis. There is little value in investing resources in changes that affect low-traffic pages or rarely used interface elements.
To evaluate Reach, we consider three dimensions:
“The overall Reach metric reflects not just page popularity, but the actual audience exposure to a hypothesis based on where it is implemented and how many users interact with that area. To calculate it, we multiply the three components — page popularity, category coverage, and UI block visibility — and then scale the result by 10 for easier use within the RICE model. The higher the Reach, the more users are likely to experience the change, and therefore the higher its priority, all else being equal.”
— Vladyslav Hetmanov, UX/UI Designer
Impact defines the potential quality and strength of a hypothesis’ influence. The key question we ask here is: if this change is implemented, how will it affect user behavior?
We evaluate UX/UI improvements and assign scores based on the level of expected impact:
“It is important not to overestimate Impact, so that prioritization results remain objective. If there is no data confirming a critical funnel issue or a strong growth opportunity, we recommend assigning a score of 1 or 2 rather than the maximum 3 points.”
— Vladyslav Hetmanov, UX/UI Designer
During CRO research, we typically generate dozens of hypotheses, but the level of confidence in them can vary significantly. Some changes are supported by solid research findings, proven case studies, and successful implementations within your industry, while others remain well-reasoned assumptions that require further validation through testing.
This is where the Confidence parameter comes in. It helps separate hypotheses with strong evidence from ideas that are still weakly supported. The more high-quality data, UX research, usability audits, or relevant case studies that support a hypothesis, the higher its confidence score. This reduces risk and allows teams to focus on changes with the highest probability of positively impacting conversion rates.
Scoring is defined as follows:
A low Confidence score does not mean a hypothesis should be discarded. However, it does reduce its priority, meaning we first focus on ideas with stronger supporting evidence.
The final parameter is Effort, which reflects the complexity of implementing a hypothesis and the amount of resources required to execute it.
This is a relative score: we take the most complex task in the current hypothesis set and assign it the maximum value. In our model, this is 4 points, while all other hypotheses are evaluated in relation to it based on the required time, development effort, and involved specialists.
“Additionally, the development team provides an estimated time effort in hours. This metric is not directly included in the RICE Score calculation, but it helps with sprint planning and resource allocation. In practice, several quick-to-implement hypotheses can often deliver more value in the same timeframe than one large, complex feature.”
— Vladyslav Hetmanov, UX/UI Designer
Once all hypotheses are evaluated across Reach, Impact, Confidence, and Effort, we calculate the final score using the formula:
RICE = (Reach × Impact × Confidence) / Effort
The higher the resulting score, the higher the priority of the hypothesis for implementation. This produces a ranked list of ideas that helps teams focus on the most effective changes first.
We’ve developed an automated calculator to help you evaluate your CRO hypotheses and prioritize them more effectively based on the RICE model.
At the same time, it is important to understand that a higher RICE score does not automatically mean a hypothesis is perfect or unquestionably the best. Rather, it represents the most rational starting point based on potential impact, level of confidence, and available resources.
While working with the Asaxiy online store — a leading eCommerce platform in Uzbekistan with a wide assortment of electronics, gadgets, and books — we developed more than 40 UX/UI and CRO hypotheses aimed at increasing overall conversion rates.
All ideas were first evaluated and prioritized using the RICE model, which allowed us to systematically identify the most promising changes in terms of potential impact, level of confidence, and required resources. The highest-ranked hypotheses were selected for A/B testing to accurately measure their effect on key business metrics.
As a result, 46% of the tested hypotheses delivered positive outcomes, confirming the effectiveness of the approach. This led to a 42% increase in store conversion rate and a 33% growth in revenue through the systematic implementation of the highest-priority and high-impact UX/UI improvements.

If your website needs to increase conversion rates, it is worth starting with a structured CRO approach and hypothesis prioritization. This methodology helps teams focus on solutions that deliver the greatest business impact while optimizing resource allocation.
Promodo is a Google Certified Partner in Conversion Rate Optimization, helping businesses scale through UX/UI improvements and a data-driven approach. Across our projects, more than 150 products have been optimized through improved interfaces and user flows, resulting in an average +10% increase in average order value on client websites.
If you want to increase conversion rates and average order value on your website, get in touch with Promodo — we will help you identify your growth opportunities.
Team Lead of Content for promodo.com
Experienced in working with data, expert recommendations, and real business cases to create clear and valuable content that delivers real business impact. Passionate about discovering new insights, exploring industry trends, and turning complex topics into practical, easy-to-understand content.
You may also like
Choose quality and trusted services to improve the presence of your company on the Internet, and feel free to contact our UK team if you have any questions.

Today we’ll be talking about why creating landing pages, customizing advertising and getting first queries are only halfway to success.

Promoting a niche business can sometimes be a challenge.

In this post, you’re given a template for competitor analysis that’s fast, free, and easy to use — perfect whether you’re a solo entrepreneur or part of a team.
We at Promodo are ready to help you improve your performance across all digital marketing channels.
Get started


.avif)

.avif)


